. 2010 Jun;12(6):464-75.
doi: 10.1593/neo.10168.

Teriflunomide (leflunomide) promotes cytostatic, antioxidant, and apoptotic effects in transformed prostate epithelial cells: evidence supporting a role for teriflunomide in prostate cancer chemoprevention

Affiliations

Teriflunomide (leflunomide) promotes cytostatic, antioxidant, and apoptotic effects in transformed prostate epithelial cells: evidence supporting a role for teriflunomide in prostate cancer chemoprevention

Numsen Hail Jr et al. Neoplasia. 2010 Jun.

Abstract

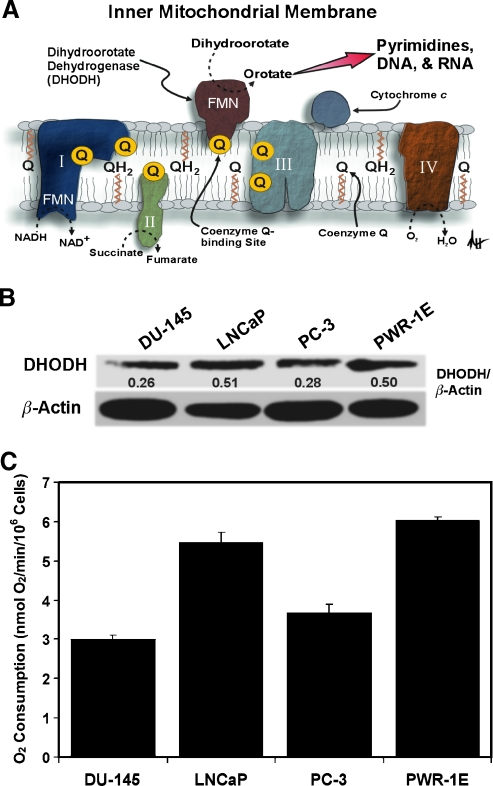
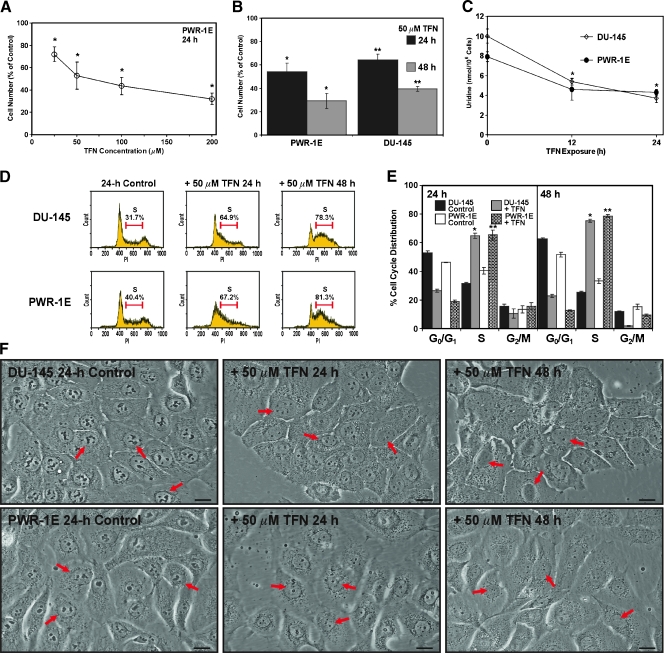
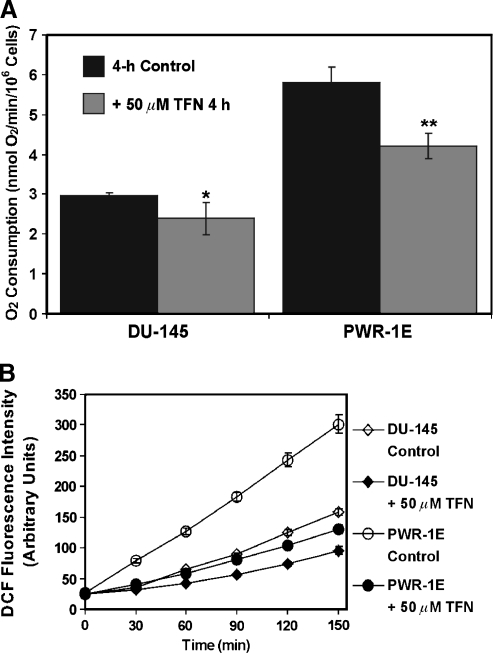
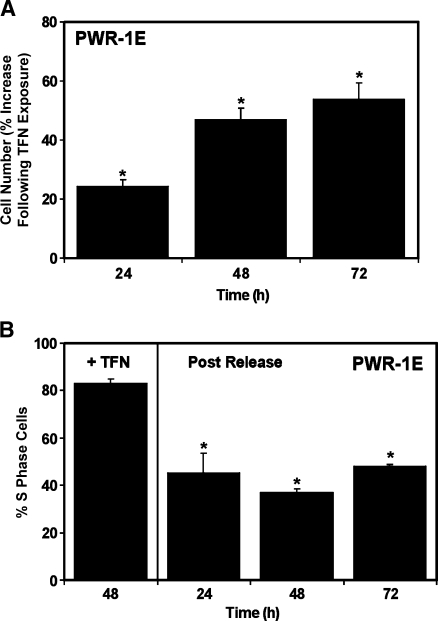
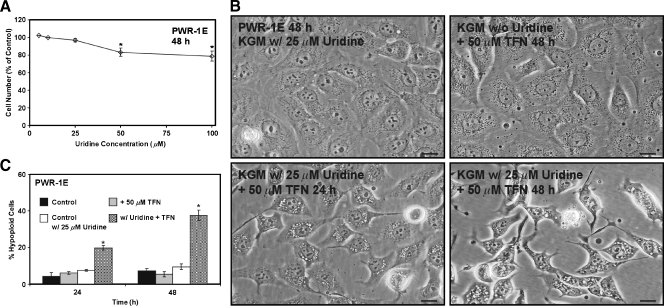
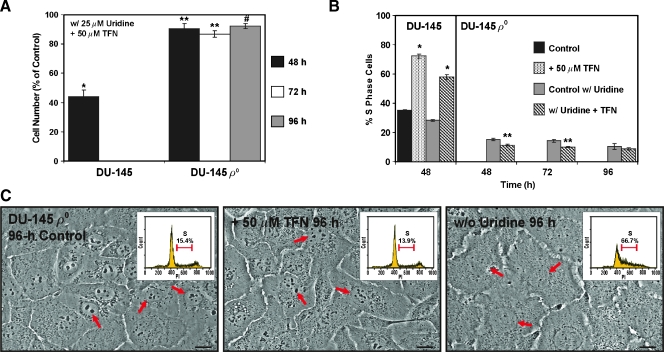
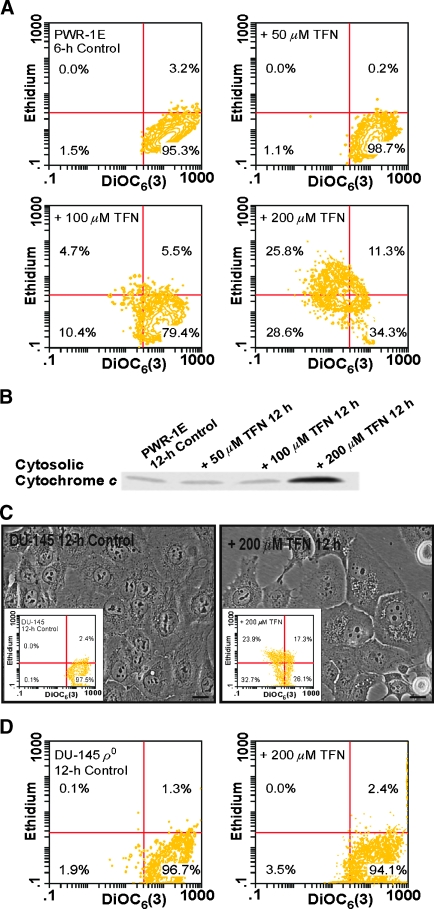
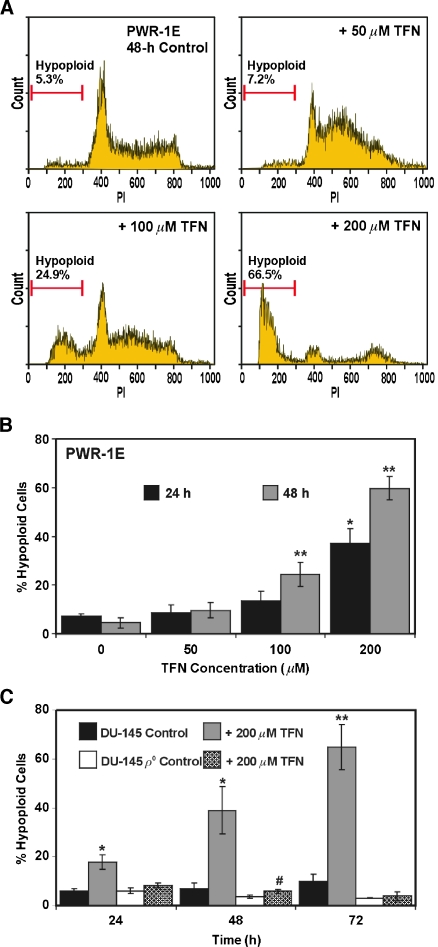
Teriflunomide (TFN) is an inhibitor of de novo pyrimidine synthesis and the active metabolite of leflunomide. Leflunomide is prescribed to patients worldwide as an immunomodulatory and anti-inflammatory disease-modifying prodrug. Leflunomide inhibited the growth of human prostate cancer xenographs in mice, and leflunomide or TFN promoted cytostasis and/or apoptosis in cultured cells. These findings suggest that TFN could be useful in prostate cancer chemoprevention. We investigated the possible mechanistic aspects of this tenet by characterizing the effects of TFN using premalignant PWR-1E and malignant DU-145 human prostate epithelial cells. TFN promoted a dose- and time-dependent cytostasis or apoptosis induction in these cells. The cytostatic effects of TFN, which were reversible but not by the presence of excess uridine in the culture medium, included diminished cellular uridine levels, an inhibition in oxygen consumption, a suppression of reactive oxygen species (ROS) generation, S-phase cell cycle arrest, and a conspicuous reduction in the size and number of the nucleoli in the nuclei of these cells. Conversely, TFN's apoptogenic effects were characteristic of catastrophic mitochondrial disruption (i.e., a dissipation of mitochondrial inner transmembrane potential, enhanced ROS production, mitochondrial cytochrome c release, and cytoplasmic vacuolization) and followed by DNA fragmentation. The respiration-deficient derivatives of the DU-145 cells, which are also uridine auxotrophs, were markedly resistant to the cytostatic and apoptotic effects of TFN, implicating de novo pyrimidine synthesis and mitochondrial bioenergetics as the primary targets for TFN in the respiration competent cells. These mechanistic findings advocate a role for TFN and mitochondrial bioenergetics in prostate cancer chemoprevention.


Figures

Figure 1
Figure 1
An assessment of DHODH expression and oxygen consumption in transformed prostate epithelial cells. (A) A diagrammatic depiction of DHODH in the inner mitochondrial membrane illustrating its role in mitochondrial bioenergetics and de novo pyrimidine synthesis. Please refer to the text for additional details (I indicates complex I; II, complex II; III, complex III; IV, complex IV; FMN, flavin mononucleotide). (B) An immunoblot analysis of DHODH expression for the DU-145, LNCaP, PC-3, and PWR-1E cells. The DHODH band intensity was normalized as a percentage of the loading control β-actin using ImageJ software. (C) The oxygen consumption rates (nmol of O2/min) were determined for approximately 106 cells.
Figure 2
Figure 2
TFN inhibits proliferation and decreases cellular uridine levels in PWR-1E and DU-145 cells. (A) The PWR-1E cells were treated for 24 hours with the indicated concentrations of TFN or an equal volume of the vehicle Me2SO (control) dissolved in fresh culture medium. The cells were harvested and counted with a hemacytometer. The relative cell number in the TFN-treated populations is presented as a percentage of the 24-hour control. P < .001 compared with control. (B) The PWR-1E and DU-145 cells were cultured, harvested, and counted as described in panel (A) after 24- and 48-hour exposures to 50 µM TFN or Me2SO (control). *P < .01 compared with the respective PWR-1E controls; **P < .01 compared with the respective DU-145 controls. (C) An assessment of the uridine levels in the DU-145 and PWR-1E cells after exposure to 50 µM TFN for the indicated times or Me2SO (control, 0-hour TFN exposure). *P < .01 compared with the 0-hour DU-145 or PWR-1E control. (D) Representative PI (DNA) histograms for the treatments described in panel (B). The percentages of S-phase cells are presented above the histograms. (E) A summary of the cell cycle analyses for the treatments described in panel (B). *P < .001 compared with the respective DU-145 controls; **P < .001 compared with the respective PWR-1E controls. (F) DU-145 and PWR-1E cells were imaged at the indicated times after treatment with 50 µM TFN or Me2SO (control). The arrows in the differential interference contrast images point to the cell nucleus. Scale bars, 18 µm.
Figure 3
Figure 3
Short-term exposure to TFN suppresses oxygen consumption and ROS production in PWR-1E and DU-145 cells. (A) The DU-145 and PWR-1E cells were treated with Me2SO (control) or 50 µM TFN in fresh culture medium for 4 hours and examined for oxygen consumption as described in Figure 1C. *P < .05 compared with the DU-145 control; **P < .01 compared with the PWR-1E control. (B) PWR-1E and DU-145 cells cultured in six-well tissue culture plates were exposed to 50 µM TFN or to an equal volume of the vehicle Me2SO (control) as described in panel (A). The medium was removed and replaced with Krebs-Ringer buffer containing 10 µg/ml 2′,7′-dichlorofluorescin diacetate. Fluorescence emission at 538 nm (representing DCF production) was measured immediately after mixing (time 0) and subsequently at 30-minute intervals during a 150-minute period. The spectrofluorimeter preformed 12 fluorescence measurements per well and provided the mean DCF fluorescence value.
Figure 4
Figure 4
Cessation of TFN treatment reverts cytostasis in PWR-1E cells. The PWR-1E cells were treated for 2 days with 50 µM TFN dissolved in fresh KGM. The cultures were examined for cell number (as described in Figure 2A) and percent S-phase cells (as described in Figure 2D). In the remaining plates, the cells received fresh KGM after the initial 48-hour exposure to TFN. These cultures were examined for cell number (A) and percent S-phase cells (B) as described previously during the next 3 days. *P < .01 compared with the PWR-1E cell number after the 48-hour TFN exposure (A); *P < .01 compared with the S-phase cell population resulting from the initial 48-hour exposure to TFN (B).
Figure 5
Figure 5
Uridine combined with TFN promotes cytotoxicity in PWR-1E cells. (A) The PWR-1E cells were cultured in KGM (control) or KGM with 5, 10, 25, 50, or 100 µM uridine for 2 days. The cells were harvested and counted as described in Figure 2A. The relative cell number in the uridine-treated cell populations is presented as a percentage of the untreated 48-hour control population. *P < .01 compared with the untreated control. (B) DIC micrographs showing PWR-1E cells cultured in KGMcontaining 25 µM uridine for 48 hours, the PWR-1E cells exposed to 50 µM TFN for 48 hours in KGM without uridine, and the PWR-1E cells exposed to 25 µM uridine and 50 µM TFN for 24 and 48 hours. Scale bars, 18 µm. (C) A summary of the hypoploid cells in the treatment populations described in panel (B). Me2SO was included in the control treatments without or with 25 µM uridine. *P < .001 compared with the TFN treatment alone.
Figure 6
Figure 6
DU-145 uridine auxotrophs oppose the acute cytostatic effects of TFN. (A) DU-145 cells and their ρo clones were cultured for the indicated times inmediumcontaining 25 µMuridine and 50 µMTFN or Me2SO (control). The cells were harvested and counted as described in Figure 2A. *P < .001 compared with the DU-145 control; **P < .01 or #P < .05 compared with the ρo control. (B) The percent S-phase cells in the indicated treatment populations was determined as described in Figure 2D. *P<.001 for the TFN-treated DU-145 cells compared with the respective control without or with uridine; **P < .01 for the TFN-treated ρo clones compared with the ρo control with uridine present. (C) The ρo clones were imaged 96 hours after treatment with 50 µM TFN, Me2SO (control), or culture without uridine. The arrows in the DIC images point to the cell nucleus. Scale bars, 18 µm. The insets in the DIC images are representative PI (DNA) histograms for the treatments indicated. The percent S-phase cells in each treatment population was determined as described in panel (B).
Figure 7
Figure 7
Mitochondrial bioenergetics confers sensitivity to TFN-induced mitochondrial disruption in premalignant and malignant prostate epithelial cells. (A) The PWR-1E cells were exposed for 6 hours to 50, 100, or 200 µM TFN or to an equal volume of the vehicleMe2SO (control). The dissipation of ΔΨm and enhanced ROS productionwere determined by concurrent stainingwith 40 nM DiOC6(3) and 5 µM dihydroethidium followed by cytofluorometric analysis. (B) An immunoblot assessment of cytosolic cytochrome c in permeabilized PWR-1E cells after a 12-hour exposure to 50, 100, or 200 µM TFN or to an equal volume of the vehicle Me2SO (control). (C) The DIC images of DU-145 cells treated for 12 hourswithMe2SO(control) or 200 µM TFN. After treatment, the cells were stained with DiOC6(3) and dihydroethidiumas described in panel (A) followed by cytofluorometric analysis. The results of this analysis are presented in the inset figures. Scale bars, 18 µm. (D) The DU-145 ρo clones were exposed for 12 hours to 200 µM TFN or to an equal volume of the vehicle Me2SO (control), stained, and analyzed by flow cytometry as described in panel (A).
Figure 8
Figure 8
DU-145 uridine auxotrophs are markedly resistant to TFN-induced apoptosis. (A) Representative PI (DNA) histograms for PWR-1E cells exposed to Me2SO (control) or to 50, 100, or 200 µM TFN for 48 hours. The gated cells detected below approximately 300 fluorescence units of PI on the linear x-axis of the representative histograms are designated the hypoploid apoptotic cell population. (B) A summary of the hypoploid PWR-1E cells observed after the 24- or 48-hour treatments described in panel (A). *P < .01 compared with the 24-hour control; **P < .01 compared with the 48-hour control. (C) The parental DU-145 cells and their ρo clones were treated for 24, 48, or 72 hours with 200 µM TFN or with an equal volume of the vehicle Me2SO (control). *P < .01 compared with the 24- or 48-hour DU-145 control; #P < .05 compared with the 48-hour DU-145 ρo control; **P < .001 compared with the 72-hour DU-145 control.

References

    1. Bettuzzi S, Brausi M, Rizzi F, Castagnetti G, Peracchia G, Corti A. Chemoprevention of human prostate cancer by oral administration of green tea catechins in volunteers with high-grade prostate intraepithelial neoplasia: a preliminary report from a one-year proof-of-principle study. Cancer Res. 2006;66:1234–1240. - PubMed
    1. Sun SY, Hail N, Jr, Lotan R. Apoptosis as a novel target for cancer chemoprevention. J Natl Cancer Inst. 2004;96:662–672. - PubMed
    1. Costello LC, Franklin RB, Feng P. Mitochondrial function, zinc, and intermediary metabolism relationships in normal prostate and prostate cancer. Mitochondrion. 2005;5:143–153. - PMC - PubMed
    1. Evans DR, Guy HI. Mammalian pyrimidine biosynthesis: fresh insights into an ancient pathway. J Biol Chem. 2004;279:33035–33038. - PubMed
    1. Davis JP, Cain GA, Pitts WJ, Magolda RL, Copeland RA. The immunosuppressive metabolite of leflunomide is a potent inhibitor of human dihydroorotate dehydrogenase. Biochemistry. 1996;35:1270–1273. - PubMed

Publication types

MeSH terms

LinkOut - more resources