. 2010 Aug 1;254(15-16):1769-1802.
doi: 10.1016/j.ccr.2009.12.023.

Electrochemistry of redox-active self-assembled monolayers

Electrochemistry of redox-active self-assembled monolayers

Amanda L Eckermann et al. Coord Chem Rev. .

Abstract

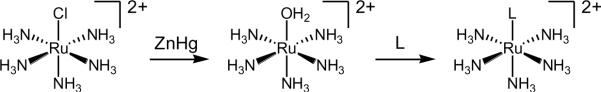
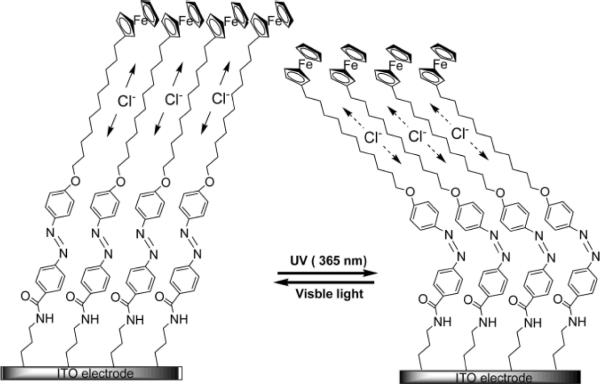
Redox-active self-assembled monolayers (SAMs) provide an excellent platform for investigating electron transfer kinetics. Using a well-defined bridge, a redox center can be positioned at a fixed distance from the electrode and electron transfer kinetics probed using a variety of electrochemical techniques. Cyclic voltammetry, AC voltammetry, electrochemical impedance spectroscopy, and chronoamperometry are most commonly used to determine the rate of electron transfer of redox-activated SAMs. A variety of redox species have been attached to SAMs, and include transition metal complexes (e.g., ferrocene, ruthenium pentaammine, osmium bisbipyridine, metal clusters) and organic molecules (e.g., galvinol, C(60)). SAMs offer an ideal environment to study the outer-sphere interactions of redox species. The composition and integrity of the monolayer and the electrode material influence the electron transfer kinetics and can be investigated using electrochemical methods. Theoretical models have been developed for investigating SAM structure. This review discusses methods and monolayer compositions for electrochemical measurements of redox-active SAMs.


Figures

Figure 1.1
Figure 1.1
Redox-active SAM consisting of a redox center, a bridge, and a diluent. Left: space-filled molecular view. Right: legend of the SAM components. The bridge connects the electrode and the redox center, while the diluent serves as a spacer molecule to isolate the redox centers from one another.
Figure 2.1
Figure 2.1
Relevant parameters of a CV of a surface-bound redox species. Parameters include: Epc, Epa, ich, ip, Q, and FWHM.
Figure 2.2
Figure 2.2
Diabatic free energy curves for nonadiabatic electron transfer. ΔG represents the driving force for ET, ΔG is the activation energy, and λ represents the reorganization energy.
Figure 2.3
Figure 2.3
A series of plots for values of λ ranging from 0.2 eV to 25 eV. These curves were generated using the Marcus model. Adapted with permission from reference [70].
Figure 2.4
Figure 2.4
Example of chronoamperometric data from a double step experiment. After a potential step, the current decays with time. Q represents the total charge that has passed to fully oxidize or reduce the surface species.
Figure 2.5
Figure 2.5
Randles circuit for a redox species attached to a monolayer. Adapted from reference [77].
Figure 2.6
Figure 2.6
(a) AC voltammetry wave form showing the oscillating component of the potential sweep (E vs. time), the measured current signal vs. time, and the data representation, AC current vs. potential. (b) The peak current ip and the background current ibare measured for a series of frequencies. The ratio ip/ib vs log frequency is plotted. (c) ACV data plot of ip/ib vs. frequency showing a distribution of rates. Reproduced with permission from reference [77]. (d) Examples of simulated ACV ip/ib plots for single rates (black and blue) and for a distribution of rates (pink) 25% 10 s−1; 25% 100 s−1; 25% 1,000 s−1, 25% 10,000s−1.
Figure 2.6
Figure 2.6
(a) AC voltammetry wave form showing the oscillating component of the potential sweep (E vs. time), the measured current signal vs. time, and the data representation, AC current vs. potential. (b) The peak current ip and the background current ibare measured for a series of frequencies. The ratio ip/ib vs log frequency is plotted. (c) ACV data plot of ip/ib vs. frequency showing a distribution of rates. Reproduced with permission from reference [77]. (d) Examples of simulated ACV ip/ib plots for single rates (black and blue) and for a distribution of rates (pink) 25% 10 s−1; 25% 100 s−1; 25% 1,000 s−1, 25% 10,000s−1.
Figure 2.7
Figure 2.7
Schematic showing the effect of a resistor and a capacitor on the phase (φ) of an alternating current (I) with respect to the voltage (E). For a resistor, current and voltage are in phase. For a capacitor, voltage lags current by 90°.
Figure 2.8
Figure 2.8
Example of a Bode plot for a series circuit containing only RSOL (100 Ω) and CDL (1 μF). Adapted from reference [46].
Figure 2.9
Figure 2.9
Example of a Nyquist plot for a series circuit containing only RSOL (100 Ω) and CDL. The vertical line on the right approaches the ZRe axis at RSOL as ω → ∞ (indicated by the arrow). For reference, points are shown at ω = 0.01 and 0.1. Adapted from reference [46].
Figure 2.10
Figure 2.10
Examples of a Nyquist plots for a Randles circuit for a redox species attached to a monolayer. RΩ = RSOL, Z'= ZRe, Z"= ZIm. RSOL is 50 Ω, CDL is 1 μF, CAD is 18.8 μF, RCT is, for (1) 133 Ω and (2) 88.8 Ω. The dashed line is the limiting ellipse for (1); this is what the plot would look like if CAD were 0 μF. See the text for descriptions of the partial ellipses and the vertical portion of the plots. Reproduced with permission from reference [97].
Figure 2.11
Figure 2.11
Schematic of mediated electron transfer using SECM. kBI is the rate of ET between ferricyanide (formed at the microelectrode tip) and Fe2+ of cytochrome c. kf is the rate of tunneling ET between cytochrome c in the Fe3+ state and the gold electrode. Reproduced with permission from reference [105].
Figure 3.1
Figure 3.1
Examples of metal complexes commonly used in SAM studies. Each complex possesses the requirements of a reversible electrochemical reaction and energetically accessible redox potential.
Figure 3.2
Figure 3.2
Synthetic scheme for the preparation of Ru(II) pentaammine complexes. The ligand, L is typically a pyridine or imidazole derivative.
Figure 3.3
Figure 3.3
Os(II) bipyridine complexes commonly used for SAM electrochemistry.
Figure 3.4
Figure 3.4
The structure of C60 and the electrochemical response in (a) CV and (b) DPV. Used with permission from [161].
Figure 3.5
Figure 3.5
(a) A monolayer acts as a barrier to electron transfer between the electrode and redox species in solution. (b) 1: CV of Ru(NH3)6Cl3 at a bare gold electrode. 2: CV of Ru(NH3)6Cl3 at a gold electrode passivated by a mixed monolayer of FcCONH(CH2)7SH and CH3(CH)8SH. The redox couple for Fc is >0.2V and is not shown. Note the μA scale of the y-axis. The current for trace 2 is on the nA scale, therefore it cannot be seen when shown on the scale needed for 1 to be visualized. Reproduced with permission from [104].
Figure 3.6
Figure 3.6
Schematic of sequential multilayer formation using [Ru33-O)(μ-CH3COO)6(4-AMP)(4-MePy)(CO)] and [Ru33-O)(μ-CH3COO)6(bpy)2(CO)]. Adapted from reference [184].
Figure 3.7
Figure 3.7
Schematic of multilayer formation using [Ru33-O)(μ-CH3COO)6(4-AMP)(4-MePy)(CO)] and [Ru2(μ-O)(μ-CH3COO)2(2,2'-bpy)2(4,4'-bpy)2](PF6)2. Adapted from reference [186].
Figure 3.8
Figure 3.8
Structure of the nickel cluster [Ni33-I)(μ3-CNR)(μ2-dppm)3]+ bound to a gold surface via a gold-thiolate bond. Adapted from reference [187].
Figure 3.9
Figure 3.9
Schematic of formation of a construct incorporating gold clusters, used to form an electrical contact between Cu(II) of galactose oxidase and a gold electrode. Reproduced with permission from reference [17].
Figure 4.1
Figure 4.1
Structures of HQ-C11 and HQ-OPV that were studied in SAMs mixed with octane-1-thiol as the diluent in reference [16].
Figure 4.2
Figure 4.2
Structure of 2-methyl-1,4-naphthoquinone studied in reference [213].
Figure 4.3
Figure 4.3
The structures of galvinoxyl (left) and 4-amino-TEMPO (right). In references 204 and , the galvinoxyl was attached to the SAM via the R group, an alkane thiol.
Figure 5.1
Figure 5.1
Illustration of possible SAM defects.
Figure 5.2
Figure 5.2
Plot of the reciprocal of the capacitance vs. SAM hydrocarbon chain length for a series of hydroxyl-terminated alkane thiols measured by cyclic voltammetry in 10 mM pH 7.4 Tris buffer with 100 mM KCl. Adapted with permission from reference [38].
Figure 5.3
Figure 5.3
Photoisomerization of azobenzene changes the SAM packing. Reproduced with permission from [292].
Figure 5.4
Figure 5.4
Bulky headgroups can interfere with formation of an ordered monolayer.
Figure 5.5
Figure 5.5
Formation of trans-[Ru(II)(NH3)4(SO3)(L1)] SAMs after initial monolayer formation via a ligand substitution reaction and peptide coupling. Adapted from reference [312].
Figure 5.6
Figure 5.6
Structure of [Os(II)(bpy)2(H2O) (PyMeNHCO(CH2)15SH)]2+ monolayer formed via a peptide coupling reaction. Adapted from reference [192].
Figure 5.5
Figure 5.5
SAM modification with ferrocene using “click” chemistry with a Cu(I)TBTA catalyst (TBTA is tris(benzyltriazolylmethyl)amine). Adapted from reference [305].
Figure 6.1
Figure 6.1
An illustration of the odd-even effect on the SAM structure. For n = odd, the terminal CH3-CH2 group is parallel to the surface normal. For n = even, the terminal CH3-CH2 group is tilted with respect to the surface normal. Adapted from reference [279].
Figure 6.2
Figure 6.2
Examples of molecules used to form SAMs where R is the attachment point for the redox center. (a) Aliphatic chains with different terminal functionalities. (b) Rigid molecules of OPE, OPV. (c) A norbornylogous bridge.
Figure 6.4
Figure 6.4
Mechanisms for the molecular dynamics effect on ET. (a) global motion-gated electron tunneling (b) electron tunneling coupled with helix conversion and (c) hole hopping along the amide backbone. Reproduced with permission from reference [80].
Figure 6.5
Figure 6.5
Peptide nucleic acid oligomer with sequence T3-X-T3 (X=C, T, A, G, CH3) from reference [136].
Figure 7.1
Figure 7.1
(a) Structure of Os p3p. (b) Tafel plot for Os monolayers adsorbed on Pt (▴), Au (∎) and carbon (●). Reproduced with permission from reference [378].

Similar articles

Cited by

References

    1. Chidsey CED. Science. 1991;251:919. - PubMed
    1. Buriak JM. Chem. Commun. 1999:1051.
    1. Creager S, Yu CJ, Bamdad C, O'Connor S, MacLean T, Lam E, Chong Y, Olsen GT, Luo J, Gozin M, Kayyem JF. J. Am. Chem. Soc. 1999;121:1059.
    1. Diederich F, Gomez-Lopez M. Chem. Soc. Rev. 1999;28:263.
    1. Willner I, Katz E. Angew. Chem., Int. Ed. Engl. 2000;39:1181. - PubMed

LinkOut - more resources