. 2010 Jun 15;8(6):e1000396.
doi: 10.1371/journal.pbio.1000396.

Drosophila microRNAs 263a/b confer robustness during development by protecting nascent sense organs from apoptosis

Affiliations

Drosophila microRNAs 263a/b confer robustness during development by protecting nascent sense organs from apoptosis

Valérie Hilgers et al. PLoS Biol. .

Abstract

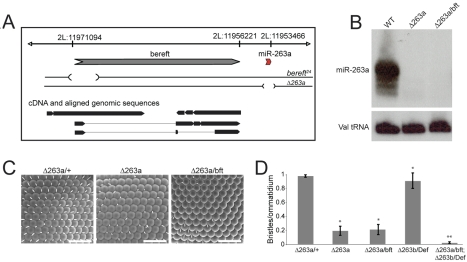
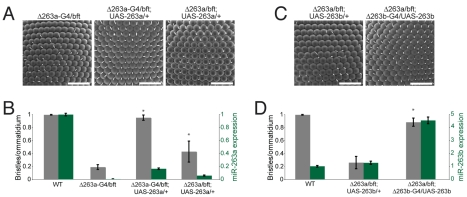
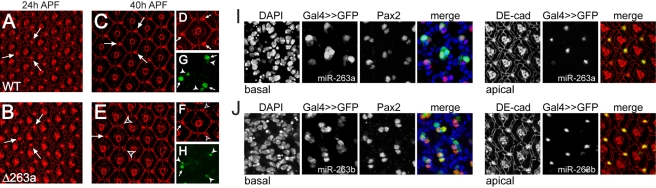
miR-263a/b are members of a conserved family of microRNAs that are expressed in peripheral sense organs across the animal kingdom. Here we present evidence that miR-263a and miR-263b play a role in protecting Drosophila mechanosensory bristles from apoptosis by down-regulating the pro-apoptotic gene head involution defective. Both microRNAs are expressed in the bristle progenitors, and despite a difference in their seed sequence, they share this key common target. In miR-263a and miR-263b deletion mutants, loss of bristles appears to be sporadic, suggesting that the role of the microRNAs may be to ensure robustness of the patterning process by promoting survival of these functionally specified cells. In the context of the retina, this mechanism ensures that the interommatidial bristles are protected during the developmentally programmed wave of cell death that prunes excess cells in order to refine the pattern of the pupal retina.


Conflict of interest statement

The authors have declared that no competing interests exist.

Figures

Figure 1
Figure 1. miR-263a and miR-263b mutants.
(A) Schematic representation of the bereft/miR-263a locus. miR-263a is located 2.7 Kb downstream of the 3′ end of the annotated bereft transcript. The extent of the 2.8 Kb deletion in the bereft24 allele and that of the 350 nt deletion in the miR-263a deletion allele (Δ263a) are indicated. (B) Northern blot showing mature miR-263a RNA levels in total RNA extracted from adult control flies (WT) and two combinations of miR-263a mutant alleles. The most abundant product of miR-263a detected by sequencing is 24 nt in length . Δ263a denotes the targeted miR-263a deletion, bft denotes the bft24 allele described in . A probe for Valine tRNA was used to monitor loading. (C) Scanning electron micrographs (SEM) of adult eyes from miR-263a/+ heterozygous control and miR-263a mutant flies. + denotes the wild-type chromosome. Scale bars = 50 µm. (D) Quantification of IOB in miR-263a and miR-263b single mutants and miR-263a miR-263b double mutant flies. “Def” denotes Df(3L)X-21.2. Error bars represent mean ± SD. N = 10–30 flies per genotype. [*] and [**] = p<0.001 using two-tailed unpaired Student's t test comparing to the miR-263a/+ control [*] or the miR-263a single mutant [**].
Figure 2
Figure 2. The miR-263a phenotype is rescued by expression of a miR-263a or overexpression of a miR-263b transgene.
(A) SEM of adult eyes from miR-263a mutants and miR-263a mutants expressing the UAS-miR-263a transgene. Δ263a denotes the targeted miR-263a deletion, Δ263a-G4 denotes the miR-263a-Gal4 knock-in allele, UAS-263a denotes the UAS-miR-263a transgene, and bft is bft24. Scale bars = 50 µm. (B) Quantification of IOB numbers (grey bars, left scale) and normalized miR-263a miRNA levels measured by miRNA qRT-PCR (green bars, scale at right). Genotypes as indicated in (A), and a wild-type control for comparison. Error bars represent mean ± SD. N = 20–25 flies per genotype. [*] p<0.001, Student's t test comparing to the miR-263a mutant. (C) SEM of adult eyes from miR-263a mutant flies expressing a UAS-miR-263b transgene under the control of miR-263b-Gal4 (right) or without a Gal4 driver (left). (D) Quantification of IOB numbers and miR-263b miRNA levels. Error bars represent mean ± SD. N = 20–30 flies per genotype. [*] p<0.001, Student's t test comparing to Δ263a/bft; UAS-263b/+.
Figure 3
Figure 3. miR-263a inhibits apoptosis in the shaft cells.
(A–H) Projections of consecutive confocal sections of segments of pupal retinas. (A, C, D, G) Wild-type controls; (B, E, F, H) miR-263a mutants. (A, B) 24 h pupae; (C–H) 40 h pupae. (A–F) Anti-DE-cadherin staining (red). IOB are visible as large brightly labelled cells at alternating vertices of the ommatidial array (arrows). Open arrowheads in (E, F) indicate interommatidial vertices with missing shaft cells. (G, H) Pax2 (green) labels the nuclei of sheath cells (arrowheads) and shaft cells (arrows). The bristle cells have undergone several rounds of endoreplication and so have larger nuclei. The nuclei in (G, H) are located at different focal planes than the cell junctions in (D, F). (I, J) Projections of confocal sections of segments of pupal retinas at 30 h APF. Basal focal planes, left to right: DAPI labelled nuclei (blue in merged image); GFP whose expression was driven with miR-263a-Gal4 (I) or miR-263b-Gal4 (J) (green in merged image); Pax2 labelled IOB sheath (small nuclei) and bristle shaft cells (large nuclei; red in merged image). Apical focal planes of the same cells, left to right: cell outlines and IOB labelled with anti-DE-cadherin (red in merged image); miR-263a (I) and miR-263b (J) expressing cells visualized by GFP expression (green in merged image). Cell junctions (apical) are located at different focal planes than cell nuclei (basal).
Figure 4
Figure 4. miR-263a inhibits apoptosis in the shaft cells.
(A) SEM of adult eyes from miR-263a mutant flies carrying UAS-p35 or UAS-DIAP1 transgenes. The left panel shows a control in which UAS-p35 was present but not driven by Gal4. Middle and right panels: transgenes were expressed under miR-263a-Gal4 control. Scale bars = 50 µm. (B) Quantification of IOB numbers. Genotypes are as indicated in (A). Error bars represent mean ± SD. N = 10 flies per genotype. [*] p<0.001, Student's t test comparing to the control. (C, D) Projections of consecutive confocal sections of segments of pupal retinas at 35 h APF. Left to right: DAPI labelled nuclei (blue in merged image); Pax2 labelled IOB sheath (small nuclei) and bristle shaft cells (large nuclei; green in merged image); Apoptotic nuclei (red in merged image); cell outlines and IOB labelled with anti-DE-cadherin. Arrows in the merged image indicate apoptosis in Pax2-expressing bristle cells. Cell junctions (DE-cad) are located at different focal planes than the nuclei in the merged image. (E) Quantification of apoptotic signal in 35 h APF retinas. Total apoptotic nuclei as well as apoptotic shaft cell nuclei were counted in control flies and miR-263a mutants and normalized to the total number of ommatidia analyzed. Error bars represent mean ± SD. N = 10 retinas per genotype. [*] p<0.001, Student's t test compared to the control.
Figure 5
Figure 5. hid downregulation by miR-263a is required for IOB formation.
(A) SEM of an adult eye expressing the endogenous hid gene from the EP line P[XP]d10274 under miR-263b-Gal4 control. (B) Normalized hid mRNA levels measured by qRT-PCR. RNA was extracted from pupal eye discs of the indicated genotypes at 30 h APF (before the IOB cells are lost in the mutant). Error bars represent mean ± SD of three independent biological replicates for each genotype. [*] p<0.001, Student's t test compared to the control (WT). (C) SEM of adult eyes from miR-263a mutant flies with reduced Hid activity. Left panel: miR-263a mutant with one copy of hid05014; middle panel: miR-263a mutant with one copy of the antimorphic hid allele W1; right panel: miR-263a mutant expressing a UAS-hid-RNAi transgene under control of miR-263b-Gal4. Scale bars = 50 µm. (D) Quantification of IOB numbers from flies of the genotypes shown in (C), and miR-263a mutant for comparison. Error bars represent mean ± SD for N = 20–25 flies per genotype. [*] p<0.001, Student's t test comparing to the miR-263a mutant.
Figure 6
Figure 6. miR-263a acts on binding sites in the hid 3′UTR.
(A) Predicted miR-263a target sites in the hid 3′UTR. Pairing to the miRNA seed sequence is shaded in grey. Nucleotides changed to generate the target site mutant UTR are shown in red. (B) Normalized firefly luciferase activity from S2 cells transfected to express control and mutated hid 3′UTR transgenes. Cells were cotransfected to express miR-263a or miR-263b or with a vector-only control, and with a plasmid expressing Renilla luciferase as a transfection control. (C) Normalized luciferase mRNA levels measured by qRT-PCR on RNA samples from cells transfected as in (B). (B, C) Error bars: SD based on six independent biological replicates for miR-263a and three independent biological replicates for miR-263b. (D) Normalized luciferase activity. Cell lysates were obtained from 30 h pupal eye imaginal discs from flies expressing a luciferase reporter carrying the hid 3′UTR, or the mutated version of it, in a miR-263a mutant or wild-type background. (E) Normalized luciferase mRNA levels. RNA was extracted from samples as in (D). (F) hid RNA levels measured using intron-specific primers (left) and exon-specific primers (right). RNA was extracted from pupal eye imaginal discs from control and miR-263a mutants at 30 h APF. Unless otherwise indicated, error bars: SD of three independent experiments. [*] p<0.001, Student's t test comparing to the control levels.
Figure 7
Figure 7. miR-263a limits Hid activity during eye development.
(A, B) SEM of adult eyes that express the activated form of hid under GMR control. (A) GMR:hid(Ala5) alone (B) GMR:hid(Ala5) lacking one genomic copy of miR-263a. (C) Quantification of missing IOB from flies of the genotypes shown in (A) and (B). The number of IOB socket cells devoid of a shaft cell was normalized to the total number of socket cells. Error bars represent mean ± SD for N = 10–15 flies per genotype. [*] p<0.005, Student's t test comparing to GMR:hid(Ala5)/+.

Similar articles

Cited by

References

    1. Cagan R. L, Ready D. F. The emergence of order in the Drosophila pupal retina. Dev Biol. 1989;136:346–362. - PubMed
    1. Carthew R. W. Pattern formation in the Drosophila eye. Curr Opin Genet Dev. 2007;17:309–313. - PMC - PubMed
    1. Wolff T, Ready D. F. Cell death in normal and rough eye mutants of Drosophila. Development. 1991;113:825–839. - PubMed
    1. Cordero J, Jassim O, Bao S, Cagan R. A role for wingless in an early pupal cell death event that contributes to patterning the Drosophila eye. Mech Dev. 2004;121:1523–1530. - PubMed
    1. Stark A, Brennecke J, Bushati N, Russell R. B, Cohen S. M. Animal MicroRNAs confer robustness to gene expression and have a significant impact on 3′UTR evolution. Cell. 2005;123:1133–1146. - PubMed

Publication types

LinkOut - more resources