Comparative Study
. 2010 Oct;121(6):1151-70.
doi: 10.1007/s00122-010-1379-5. Epub 2010 Jun 20.

Population structure and linkage disequilibrium unravelled in tetraploid potato

Affiliations
Comparative Study

Population structure and linkage disequilibrium unravelled in tetraploid potato

Björn B D'hoop et al. Theor Appl Genet. 2010 Oct.

Abstract

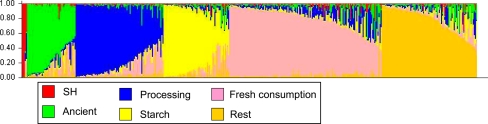
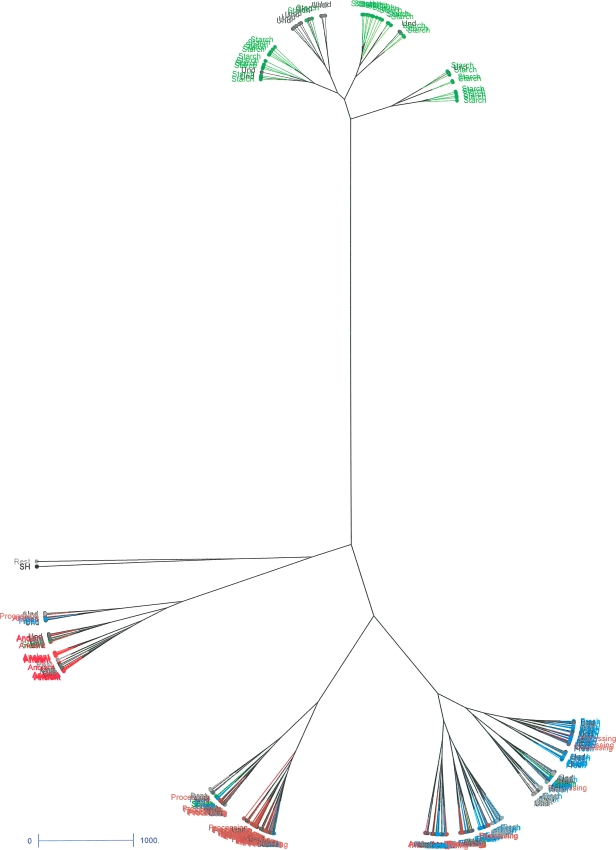
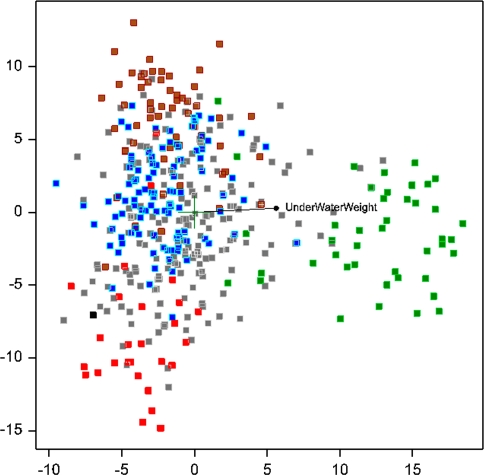
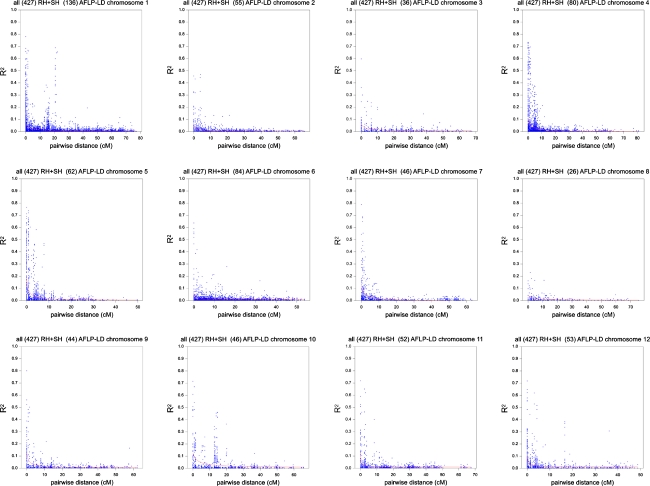
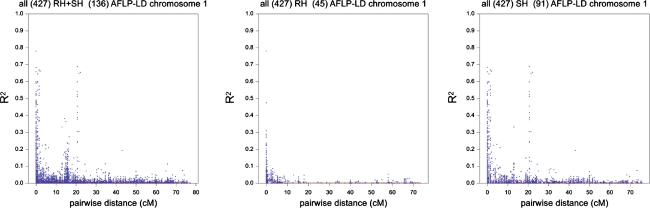
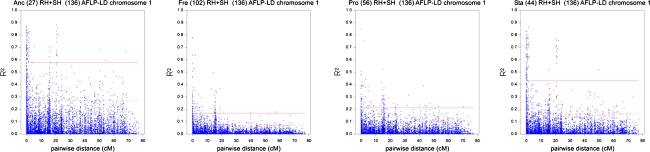
Association mapping is considered to be an important alternative strategy for the identification of quantitative trait loci (QTL) as compared to traditional QTL mapping. A necessary prerequisite for association analysis to succeed is detailed information regarding hidden population structure and the extent of linkage disequilibrium. A collection of 430 tetraploid potato cultivars, comprising two association panels, has been analysed with 41 AFLP(®) and 53 SSR primer combinations yielding 3364 AFLP fragments and 653 microsatellite alleles, respectively. Polymorphism information content values and detected number of alleles for the SSRs studied illustrate that commercial potato germplasm seems to be equally diverse as Latin American landrace material. Genome-wide linkage disequilibrium (LD)-reported for the first time for tetraploid potato-was observed up to approximately 5 cM using r (2) higher than 0.1 as a criterion for significant LD. Within-group LD, however, stretched on average twice as far when compared to overall LD. A Bayesian approach, a distance-based hierarchical clustering approach as well as principal coordinate analysis were adopted to enquire into population structure. Groups differing in year of market release and market segment (starch, processing industry and fresh consumption) were repeatedly detected. The observation of LD up to 5 cM is promising because the required marker density is not likely to disable the possibilities for association mapping research in tetraploid potato. Population structure appeared to be weak, but strong enough to demand careful modelling of genetic relationships in subsequent marker-trait association analyses. There seems to be a good chance that linkage-based marker-trait associations can be identified at moderate marker densities.


Figures

Fig. 1
Fig. 1
Structure solution. Bar plot of individual potato cultivars generated by Structure 2.1 using the admixture model with independent allele frequencies. Marker data consisted of 103 AFLPs, spaced every 5 cM on the ultra dense potato genetic map (van Os et al. 2006). Groups are represented by colours, as indicated in the legend. Each column (430 in total) represents a cultivar its genotype and is partitioned into segments indicating its likely genetic origin. The longer a segment the more a genotype resembles one of the inferred six groups
Fig. 2
Fig. 2
Ward tree obtained with the complete set. The tree was created with DARwin 5 based on 3364 AFLP fragments using log-transformed normalised band intensities. Individuals have been given labels according to groups detected with Structure, restricted to group membership probabilities exceeding 0.7. The label undetermined (Und in the figure) refers to cultivars with group membership probabilities lower than 0.7
Fig. 3
Fig. 3
Principal coordinate plot overlaid with the phenotypic trait best matching the variation based on regression analysis. The individuals are coloured with respect to their group identity according to Structure (70% group membership): green indicates starch, red indicates ancient, blue indicates fresh consumption, brown indicates processing cultivars and black represents SH. Light grey indicates undetermined cultivars (no group membership exceeding 0.7) together with the Rest group
Fig. 4
Fig. 4
Genome-wide LD in potato. LD decay across the 12 potato chromosomes based on 720 AFLP markers collected over 427 potato genotypes using log-transformed normalised band intensities. As LD measure r 2 has been used. Map positions in cM were deduced from the ultra dense potato genetic map (van Os et al. 2006). Each plot represents the LD pattern of one chromosome. The title of each plot mentions the number of markers between brackets that was used for the pattern reconstruction of a particular chromosome, e.g., 136 for chromosome 1
Fig. 5
Fig. 5
Parent-specific recombination and LD. Illustration of the effect of differential parental recombination on the LD decay of chromosome 1. On the left, the decay plot is shown for all 136 markers, in the middle the decay plot is shown for markers exclusively residing on the paternal map (RH, 45 AFLPs in total) and on the right the decay is presented for the 91 markers only residing on the maternal map (SH)
Fig. 6
Fig. 6
Group-specific LD patterns for chromosome 1. From left to right LD decay plots are presented for four groups previously discovered with Structure and restricted to cultivars with group membership probabilities exceeding 0.7. For each plot, the title names first the group itself (Anc ancient; Fre fresh consumption; Pro processing; Sta starch) followed by the number of cultivars allocated to the group. In each case markers from both paternal and maternal map were combined, the total number of markers is mentioned in the title as well. Horizontal lines in each plot represent the calculated significance thresholds for the 0.95 quantile (striped) and the 0.99 quantile (full)

References

    1. Agrama H, Eizenga G, Yan W. Association mapping of yield and its components in rice cultivars. Mol Breed. 2007;19:341–356. doi: 10.1007/s11032-006-9066-6. - DOI
    1. Bennett M, Leitch I (2004) Angiosperm DNA C-values database (release 5.0, Dec. 2004). http://www.kew.org/cvalues/homepage.html
    1. Bradshaw JE, Pande B, Bryan GJ, Hackett CA, McLean K, Stewart HE, Waugh R. Interval mapping of quantitative trait loci for resistance to late blight [Phytophthora infestans (Mont.) de Bary], height and maturity in a tetraploid population of potato (Solanum tuberosum subsp tuberosum) Genetics. 2004;168:983–995. doi: 10.1534/genetics.104.030056. - DOI - PMC - PubMed
    1. Bradshaw JE, Hackett CA, Pande B, Waugh R, Bryan GJ. QTL mapping of yield, agronomic and quality traits in tetraploid potato (Solanum tuberosum subsp tuberosum) Theor Appl Genet. 2008;116:193–211. doi: 10.1007/s00122-007-0659-1. - DOI - PubMed
    1. Breseghello F, Sorrells ME. Association mapping of kernel size and milling quality in wheat (Triticum aestivum L.) cultivars. Genetics. 2006;172:1165–1177. doi: 10.1534/genetics.105.044586. - DOI - PMC - PubMed

Publication types