

CFL1 expression levels as a prognostic and drug resistance marker in nonsmall cell lung cancer
- PMID: 20564088
- PMCID: PMC2910822
- DOI: 10.1002/cncr.25125
CFL1 expression levels as a prognostic and drug resistance marker in nonsmall cell lung cancer
Abstract
Background: Nonsmall cell lung cancer (NSCLC) is the major determinant of overall cancer mortality worldwide. Despite progress in molecular research, current treatments offer limited benefits. Because NSCLC generates early metastasis, and this behavior requires great cell motility, herein the authors assessed the potential value of CFL1 gene (main member of the invasion/metastasis pathway) as a prognostic and predictive NSCLC biomarker.
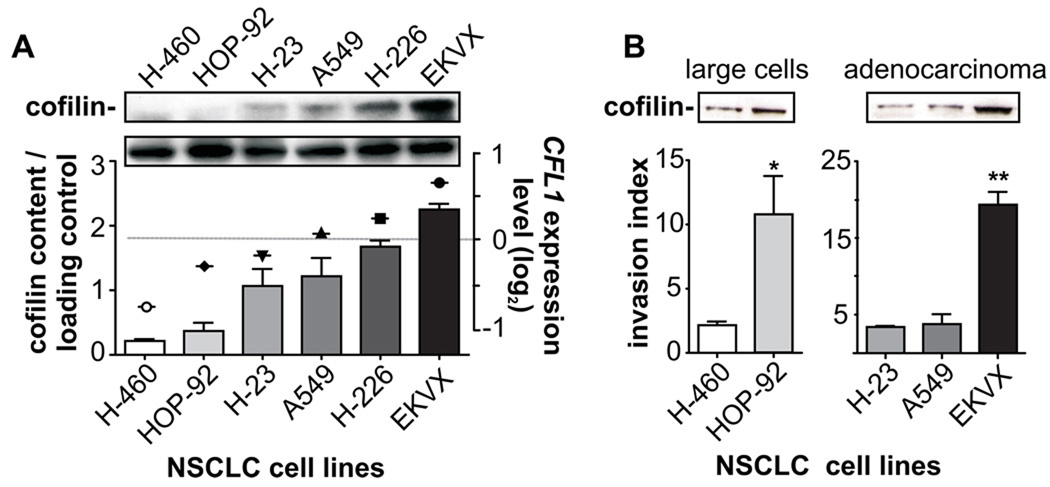
Methods: Metadata analysis of tumor tissue microarray was applied to examine expression of CFL1 in archival lung cancer samples from 111 patients, and its clinicopathologic significance was investigated. The robustness of the finding was validated using another independent data set. Finally, the authors assayed in vitro the role of CFL1 levels in tumor invasiveness and drug resistance using 6 human NSCLC cell lines with different basal degrees of CFL1 gene expression.
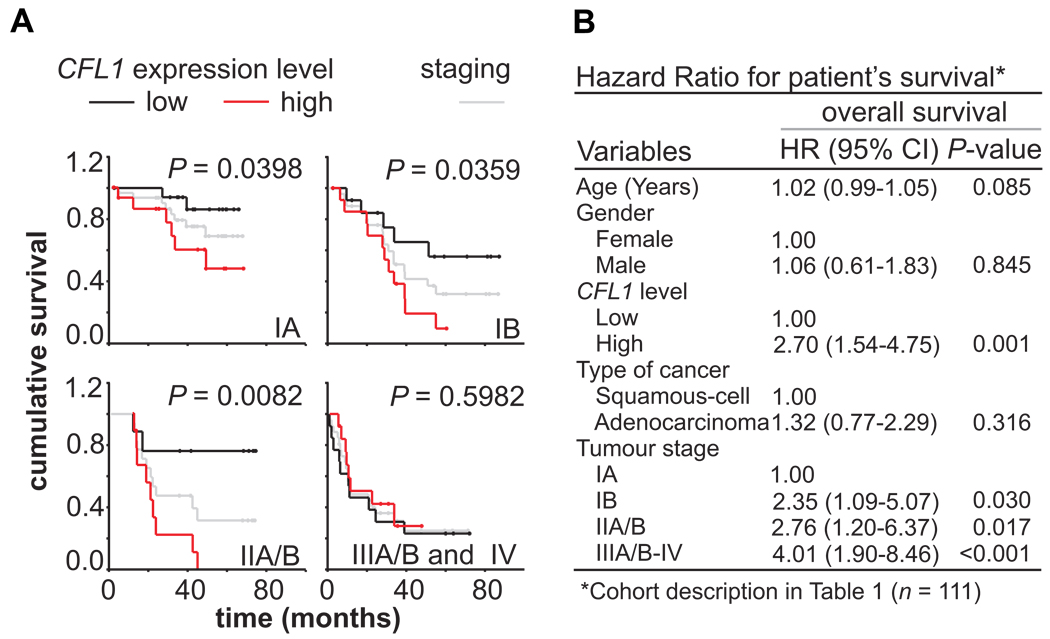
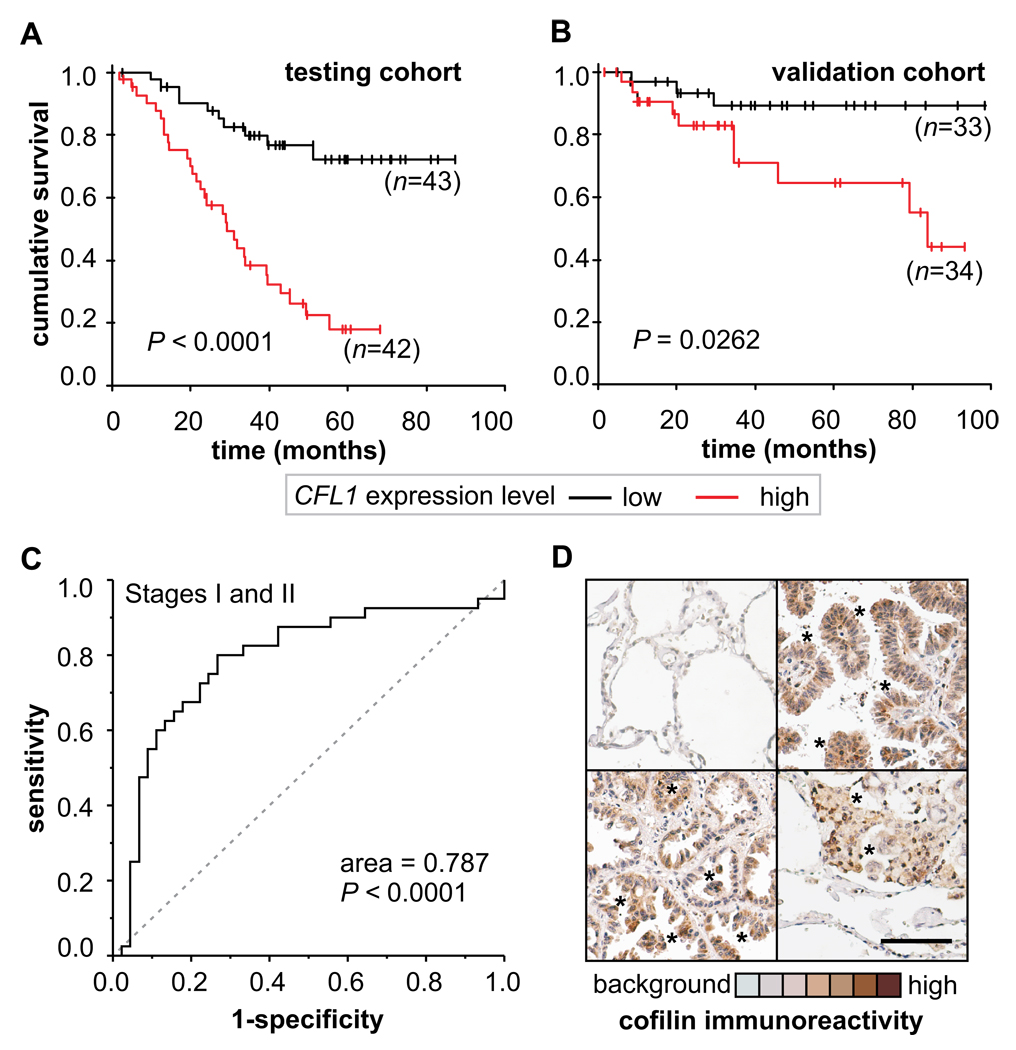
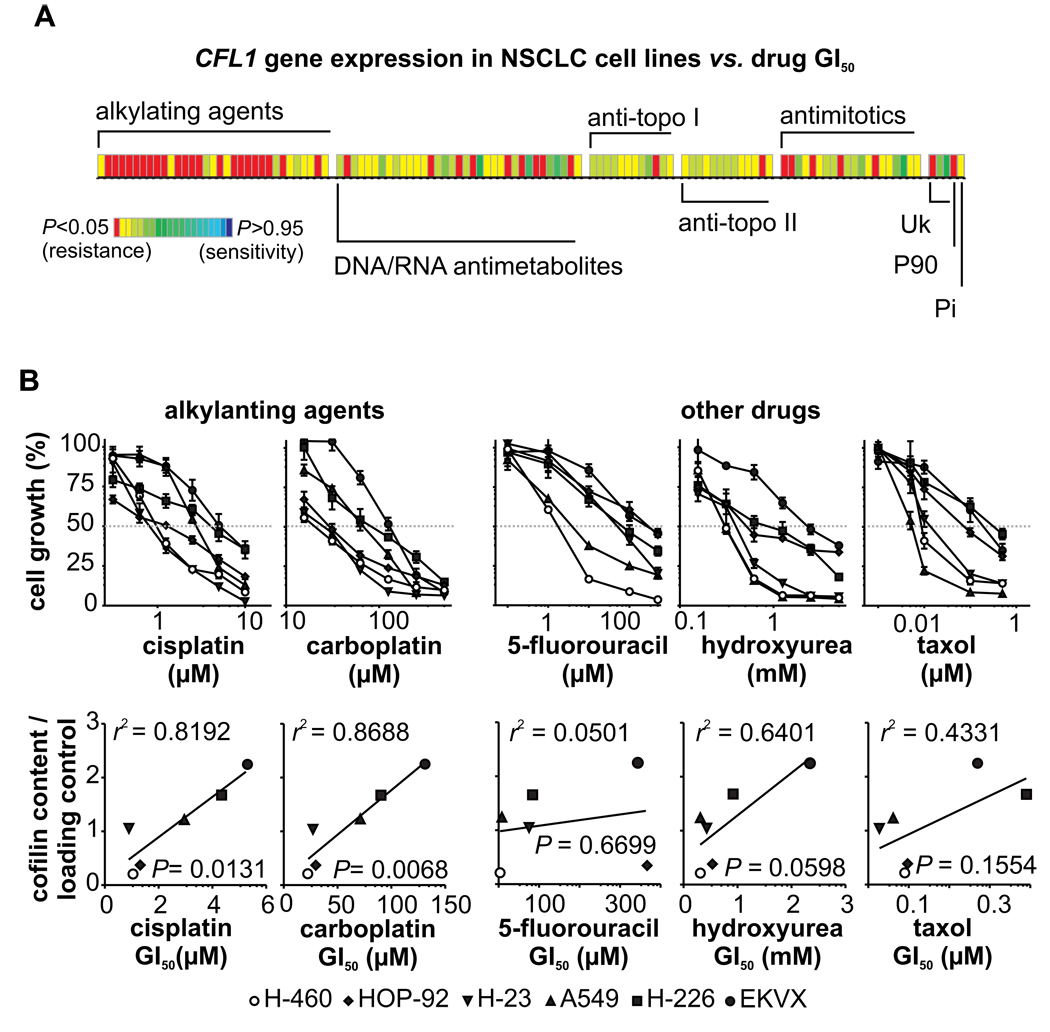
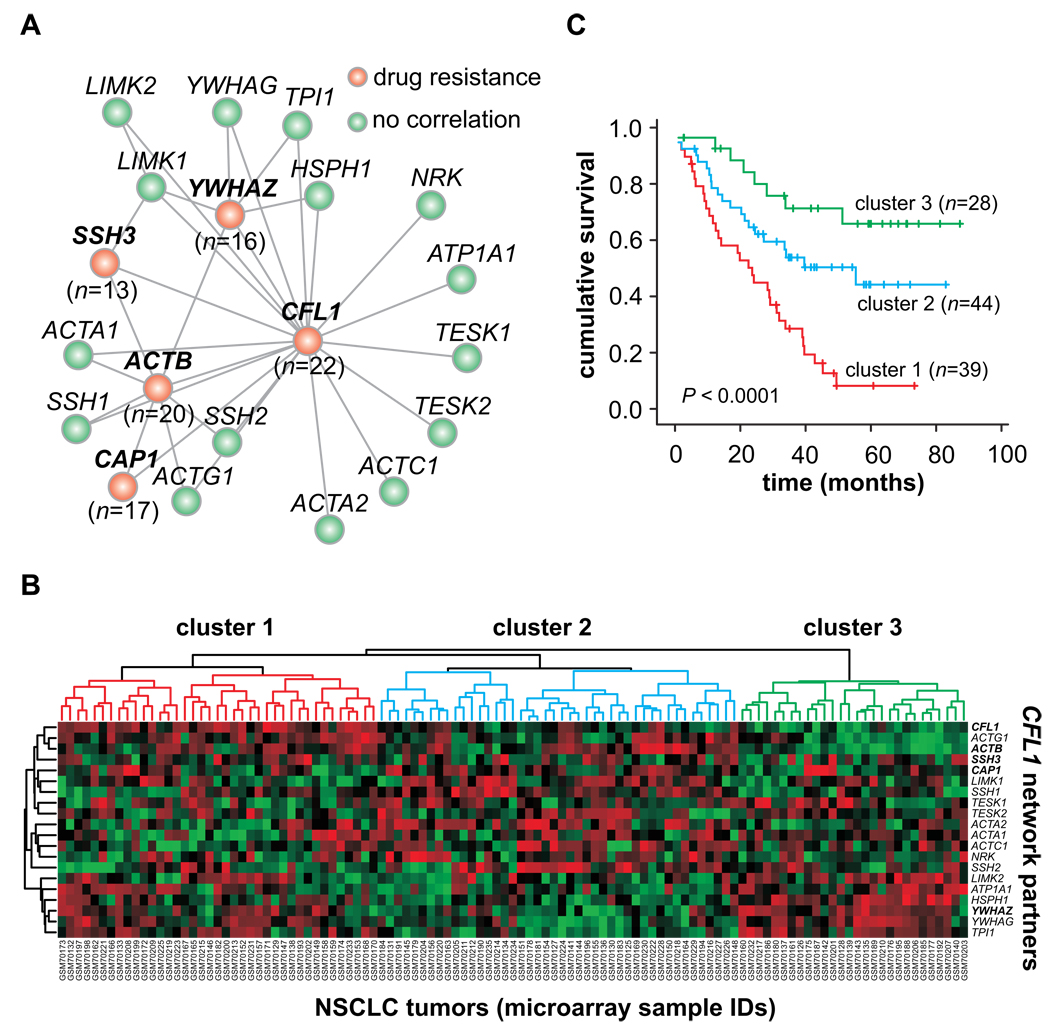
Results: CFL1 levels in biopsies discriminate between good and bad prognosis at early tumor stages (IA, IB, and IIA/B), where high CFL1 levels are correlated with lower overall survival rate (P<.0001). Biomarker performance was further analyzed by immunohistochemistry, hazard ratio (P<.001), and receiver-operating characteristic curve (area=0.787; P<.001). High CFL1 mRNA levels and protein content are positively correlated with cellular invasiveness (determined by Matrigel Invasion Chamber System) and resistance (2-fold increase in drug 50% growth inhibition dose) against a list of 22 alkylating agents. Hierarchical clustering analysis of the CFL1 gene network had the same robustness for stratified NSCLC patients.
Conclusions: This study indicates that the CFL1 gene and its functional gene network can be used as prognostic biomarkers for NSCLC and could also guide chemotherapeutic interventions.
Copyright (c) 2010 American Cancer Society.
Figures
Similar articles
-
High cofilin-1 levels correlate with cisplatin resistance in lung adenocarcinomas.Tumour Biol. 2014 Feb;35(2):1233-8. doi: 10.1007/s13277-013-1164-6. Epub 2013 Sep 10. Tumour Biol. 2014. PMID: 24018823
-
The expression of CFL1 and N-WASP in esophageal squamous cell carcinoma and its correlation with clinicopathological features.Dis Esophagus. 2010 Aug;23(6):512-21. doi: 10.1111/j.1442-2050.2009.01035.x. Epub 2010 Jan 20. Dis Esophagus. 2010. PMID: 20095995
-
Comparison of cofilin‑1 and Twist‑1 protein expression in human non‑small cell lung cancer tissues.Oncol Rep. 2019 Aug;42(2):805-816. doi: 10.3892/or.2019.7193. Epub 2019 Jun 10. Oncol Rep. 2019. PMID: 31233187
-
Relationship of intracellular proteolysis with CAP1 and cofilin1 in non-small-cell lung cancer.J Biosci. 2021;46:55. J Biosci. 2021. PMID: 34148878
-
Expression of UGP2 and CFL1 expression levels in benign and malignant pancreatic lesions and their clinicopathological significance.World J Surg Oncol. 2018 Jan 18;16(1):11. doi: 10.1186/s12957-018-1316-7. World J Surg Oncol. 2018. PMID: 29347944 Free PMC article.
Cited by
-
High cofilin-1 levels correlate with cisplatin resistance in lung adenocarcinomas.Tumour Biol. 2014 Feb;35(2):1233-8. doi: 10.1007/s13277-013-1164-6. Epub 2013 Sep 10. Tumour Biol. 2014. PMID: 24018823
-
Green tea extract and hydroxyl-chloroquine combination enhances apoptosis in A549 non-small cell lung cancer cells.Bioinformation. 2023 Aug 31;19(8):860-865. doi: 10.6026/97320630019860. eCollection 2023. Bioinformation. 2023. PMID: 37908618 Free PMC article.
-
Differential proteomic analysis of children infected with respiratory syncytial virus.Braz J Med Biol Res. 2021 Feb 26;54(4):e9850. doi: 10.1590/1414-431X20209850. eCollection 2021. Braz J Med Biol Res. 2021. PMID: 33656056 Free PMC article.
-
Potential crosstalk between cofilin-1 and EGFR pathways in cisplatin resistance of non-small-cell lung cancer.Oncotarget. 2015 Feb 28;6(6):3531-9. doi: 10.18632/oncotarget.3471. Oncotarget. 2015. PMID: 25784483 Free PMC article.
-
Proteomic Investigation of Malignant Major Salivary Gland Tumors.Head Neck Pathol. 2020 Jun;14(2):362-373. doi: 10.1007/s12105-019-01040-2. Epub 2019 May 16. Head Neck Pathol. 2020. PMID: 31098787 Free PMC article.
References
-
- Jemal A, Siegel R, Ward E, et al. Cancer Statistics, 2009. CA Cancer J Clin. 2009;59:1–25. - PubMed
-
- Potti A, Mukherjee S, Petersen R, et al. A Genomic Strategy to Refine Prognosis in Early-Stage Non-Small-Cell Lung Cancer. N Engl J Med. 2006;355:570–580. - PubMed
-
- Greene FL, Page DL, Fleming ID, Fritz A, Balch CM, Haller DG, Morrow M. AJCC Cancer Staging Manual. 6.ed. New York: Springer; 2002.
-
- Ludwig JA, Weinstein JN. Biomarkers in Cancer Staging, Prognosis and Treatment Selection. Nat Rev Cancer. 2005;5:845–856. - PubMed
-
- Kaminski N, Krupsky M. Gene expression patterns, prognostic and diagnostic markers, and lung cancer biology. Chest. 2004;125:111S–115S. - PubMed
Publication types
MeSH terms
Substances
Grants and funding
LinkOut - more resources
Full Text Sources
Medical
Research Materials
Miscellaneous
