. 2010 Nov;25(11):2479-88.
doi: 10.1002/jbmr.160.

Glucocorticoid-induced autophagy in osteocytes

Affiliations

Glucocorticoid-induced autophagy in osteocytes

Xuechun Xia et al. J Bone Miner Res. 2010 Nov.

Abstract

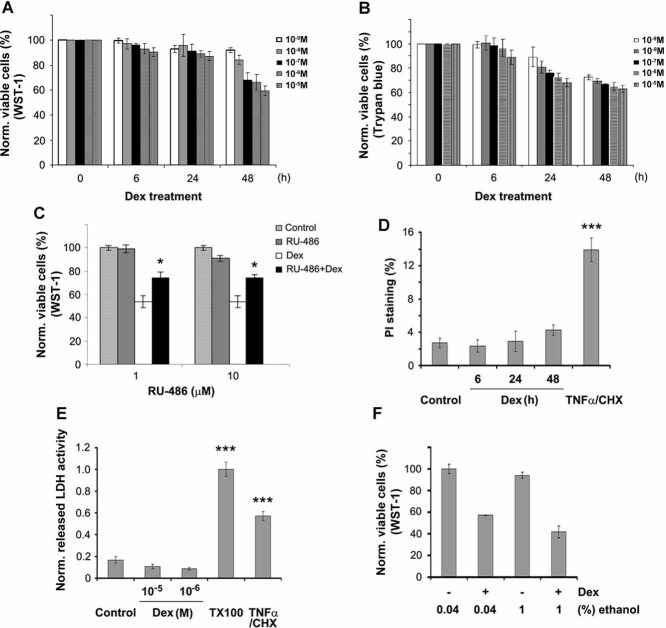
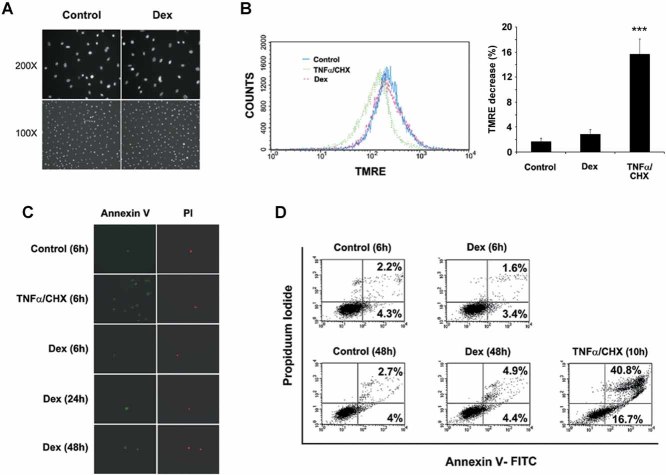
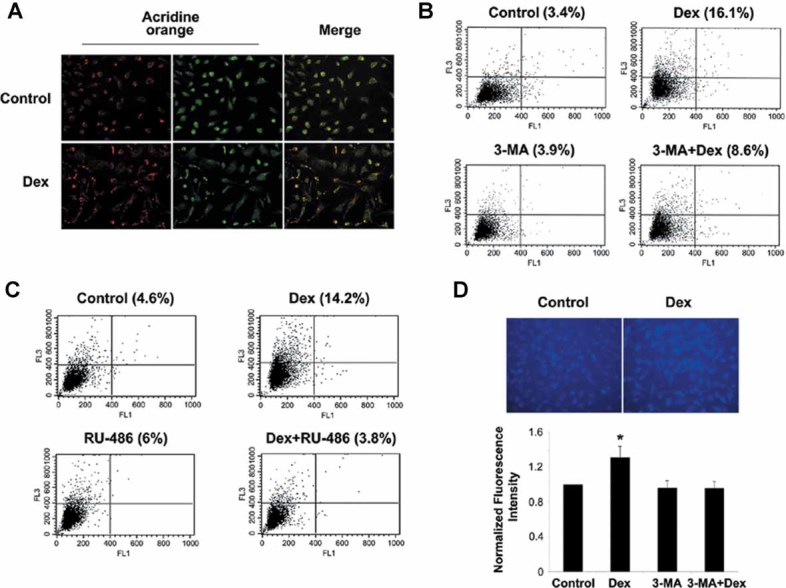
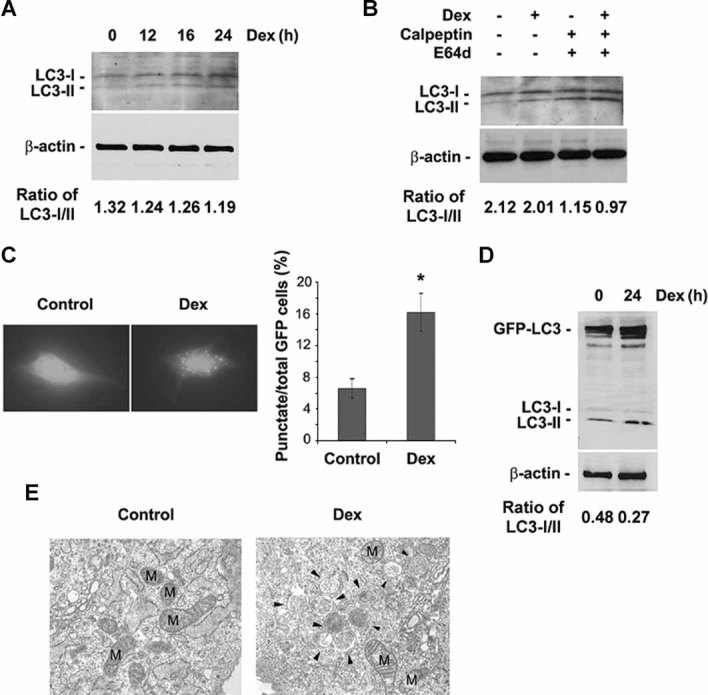
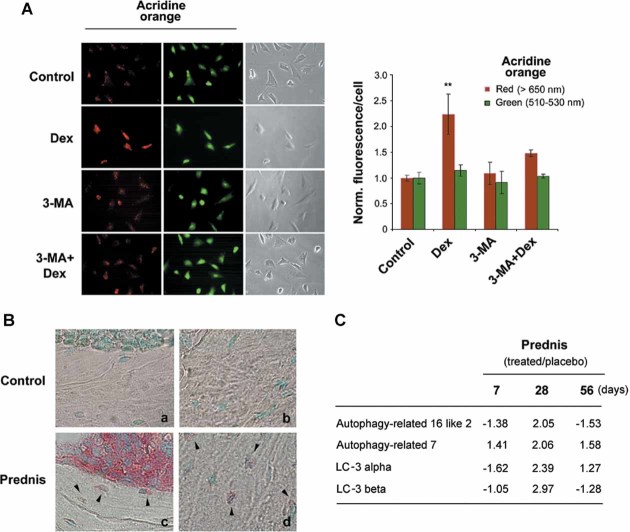
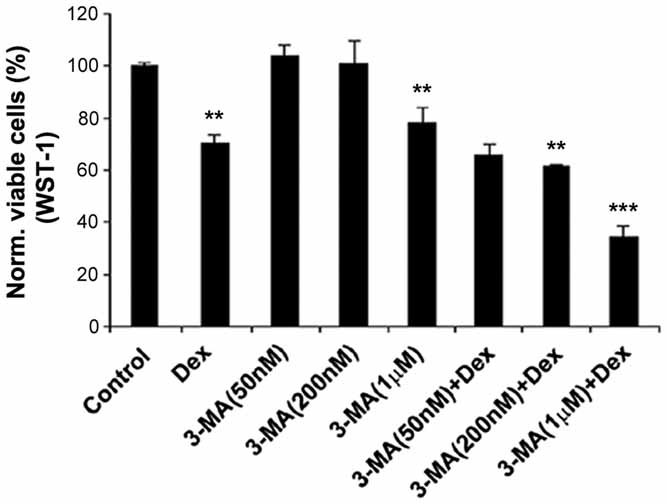
Glucocorticoid (GC) therapy is the most frequent cause of secondary osteoporosis. In this study we have demonstrated that GC treatment induced the development of autophagy, preserving osteocyte viability. GC treatment resulted in an increase in autophagy markers and the accumulation of autophagosome vacuoles in vitro and in vivo promoted the onset of the osteocyte autophagy, as determined by expression of autophagy markers in an animal model of GC-induced osteoporosis. An autophagy inhibitor reversed the protective effects of GCs. The effects of GCs on osteocytes were in contrast to tumor necrosis factor α (TNF-α), which induced apoptosis but not autophagy. Together this study reveals a novel mechanism for the effect of GC on osteocytes, shedding new insight into mechanisms responsible for bone loss in patients receiving GC therapy.


Figures

Fig. 1
Fig. 1
Reduction of MLO-Y4 cell number by Dex. (A, B) MLO-Y4 cells were treated with Dex at 10−5, 10−6, 10−7, 10−8, and 10−9 M for 0, 6, 24, and 48 hours. The number of viable cells was measured using WST-1 or trypan blue dye exclusion assay. No or few trypan blue cells were detected. (C) Cells were pretreated with 1 or 10 µM RU486 prior to the application of Dex, and the cell number was determined using WST-1. RU486 partially reversed the negative effects of Dex on the number of live MLO-Y4 cells. (1 or 10 µM RU486 plus Dex–treated versus only Dex-treated samples: *p < .05.) (D) Cells were treated with 10−6 M Dex for 6, 24, and 48 hours or with 10 ng/mL of TNF-α/CHX for 6 hours. Cell number was analyzed by PI staining, and the number of PI-labeled cells was quantified. (TNF-α/CHX-treated versus control samples: ***p < .001.) (E) Cell membrane damage was measured by release of the cytoplasmic enzyme lactate dehydrogenase (LDH) from MLO-Y4 cells treated with Dex or TNF-α/CHX. (48 hours of Dex- or TNF-α/CHX-treated versus control: ***p < .001.) (F) Cells were treated with 0.04% or 1% ethanol or Dex dissolved in 0.04% or 1% ethanol, and cytotoxicity was determined using WST-1 assay. All data are presented as mean ± SD and n = 3.
Fig. 2
Fig. 2
The major effects of Dex on MLO-Y4 cell number is not due to induced cell apoptosis. (A) MLO-Y4 cells were treated in the absence or presence of 10−6 M Dex for 48 hours and then labeled with DAPI. (B) Cells were treated with 10−6 M Dex or TNF-α/CHX for 48 hours, and suspended cells were stained with 100 nM TMRE and analyzed using flow cytometry and quantified (right panel). (TNF-α/CHX versus control and Dex-treated: ***p < .001.) (C) MLO-Y4 cells treated in the absence or presence of 10−6 M Dex for 6, 24, and 48 hours or TNF-α/CHX for 10 hours, labeled with Annexin-V-FLOUS Staining Kit and PI. (D) After treatment with 10−6 M Dex for 6 and 48 hours or TNF-α/CHX for 10 hours, detached and attached cells were analyzed using flow cytometry.
Fig. 3
Fig. 3
Induction of autophagy in MLO-Y4 cells by Dex. (A) Dex induced the development of autophagy. MLO-Y4 cells were treated in the absence or presence of 10−6 M Dex for 48 hours and labeled with acridine orange. (B) Cells were treated with 10−6 M Dex for 48 hours in the absence or presence of 0.5 mM 3-MA. 3-MA was added 1 hour prior to Dex treatment. Cells in suspension were labeled with acridine orange and quantified using flow cytometry (gate set at 5%), and the data were analyzed by CellQuest software. FL1-H indicates green color intensity (cytoplasm and nucleus), whereas FL3-H shows red color intensity (AVO). (C) Cells were treated with 10−6 M Dex for 48 hours in the absence or presence of 10 µM RU486. The latter was added 1 hour prior to Dex. Acridine orange–labeled cells in suspension were quantified using flow cytometry. (D) Cells were treated with 10−6 M Dex for 48 hours in the absence or presence of 0.5 mM 3-MA. 3-MA was added 1 hour prior to Dex treatment. Cells then were labeled with MDC, and the intensity of the staining was quantified by measuring fluorescence in cell lysate using a fluorometer. (Dex-treated versus others: *p < .05.) The data are presented as mean ± SD and n = 3.
Fig. 4
Fig. 4
Dex increased LC3 levels and autophagosome development. (A) MLO-Y4 cells were treated with or without 10−6 M Dex for the indicated times and then subjected to immunoblotting analysis using anti-LC3 or anti-β-actin antibody. The band intensity was quantified, and the ratio of LC3-I/LC3-II was presented at the bottom of the blot. (B) Cells were treated with or without 10−6 M Dex for 24 hours in the absence or presence of E64d (10 mg/mL) or calpeptin (10 mg/mL). The latter two reagents were added 1 hour prior to Dex. The band intensity was quantified, and the ratio of LC3-I/LC3-II was presented at the bottom of the blot. (C) Cells were transiently transfected with GFP-LC3 construct for 24 hours, then treated with or without 10−6 M Dex for an additional 24 hours, and then examined by fluorescence microscopy. The percentage of GFP-LC3+ cells with GFP-LC3 punctate dots was quantified by counting the number of cells showing the punctate pattern of LC3-GFP in 100 GFP+ cells. (Dex versus control: *p < .05.) The data are presented as mean ± SD and n = 3. (D) Cells were treated with 10−6 M Dex for 24 hours after being transiently transfected with GFP-LC3 construct for 24 hours. Cell lysates were analyzed by Western blot. The band intensity was quantified, and the ratio of LC3-I/LC3-II was presented at the bottom of the blot. (E) Cells were treated with 10−6 M Dex for 24 hours, and fixed cells were processed for thin-section electron microscopy. M indicates mitochondrial structures, and arrowheads indicate autophagosomes.
Fig. 5
Fig. 5
GCs increased markers of autophagy in primary osteocytes and in osteocytes within bone tissues from GC-treated mice. (A) Primary osteocytes isolated from chicken calvaria were treated with or without 10−6 Dex for 48 hours in the absence or presence of 3-MA (0.5 mM). 3-MA was added 1 hour before Dex treatment. Cells then were labeled with acridine orange, and green and red fluorescence was detected in acridine orange–stained cells using a fluorescence microscope (left panel). The staining intensity of acridine orange in the acquired images was quantified with NIH ImageJ analysis software (right panel). About 100 cells per sample were analyzed and normalized to control. (Red fluorescence in Dex-treated cells versus other treatment: **p < .01; *p < 0.05.) The data are presented as mean ± SD and n = 3. (B) Mice were treated with 5 mg of prednisolone for 60 days (prednis) (c and d) or with placebo (controls) (a and b). Paraffin sections were immunolabeled with anti-LC3 antibody, followed by incubation with AP-linked anti-rabbit secondary antibody, and counterstained with methyl-green. Arrowheads indicate LC3-labeled osteocytes. (C) RNA was extracted from the long bones of placebo- or prednisolone (prednis)–treated mice, gene microarray was conducted, and raw data were processed. Transcripts related to autophagy are increased after prednisolone treatment.
Fig. 6
Fig. 6
The reduction in normal cell number by Dex was augmented by 3-MA. MLO-Y4 cells were pretreated in the absence or presence of 50 and 200 nM and 1 µM of 3-MA prior to application of 10−6 M Dex. Cell viability was determined using WST-1. [Dex or 3-MA (1 µM) versus control: **p < .01; 3-MA (200nM) + Dex versus Dex: **p < .01; 3-MA (1 µM) + Dex versus Dex: ***p < .001.] All data are presented as mean ± SD and n = 3.

References

    1. Weinstein R. Glucocorticoid-induced osteoporosis. In: Rosen CJ, editor. Primer on the Metabolic Bone Diseases and Disorders of Mineral Metabolism. Washington, DC: American Society of Bone and Mineral Research; 2008.
    1. Canalis E, Delany AM. Mechanisms of glucocorticoid action in bone. Ann NY Acad Sci. 2002;966:73–81. - PubMed
    1. Weinstein RS, Jilka RL, Parfitt AM, Manolagas SC. Inhibition of osteoblastogenesis and promotion of apoptosis of osteoblasts and osteocytes by glucocorticoids. J Clin Invest. 1998;102:274–282. - PMC - PubMed
    1. O'Brien CA, Jia D, Plotkin LI, et al. Glucocorticoids act directly on osteoblasts and osteocytes to induce their apoptosis and reduce bone formation and strength. Endocrinology. 2004;145:1835–1841. - PubMed
    1. Gohel A, McCarthy MB, Gronowicz G. Estrogen prevents glucocorticoid-induced apopotosis in osteoblasts in vivo and in vitro. Endocrinology. 1999;140:5339–5347. - PubMed

Publication types