

Neural tube defect genes and maternal diabetes during pregnancy
- PMID: 20564432
- PMCID: PMC3509193
- DOI: 10.1002/bdra.20680
Neural tube defect genes and maternal diabetes during pregnancy
Abstract
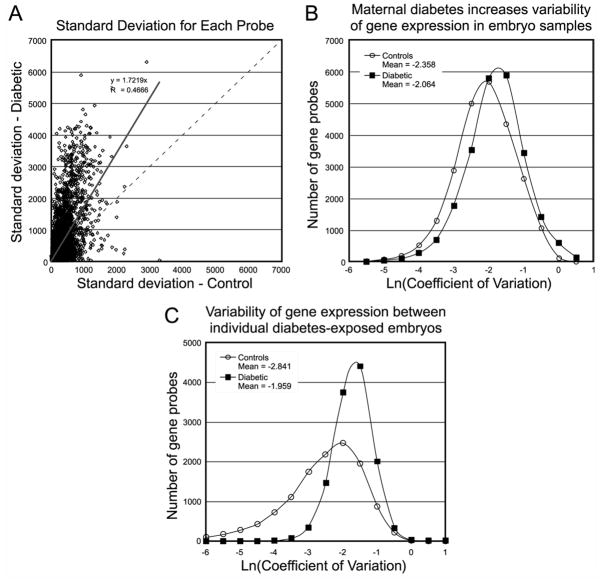
Background: Maternal diabetes during pregnancy is a well-known teratogen that increases the risk for birth defects, such as neural tube defects (NTDs). We have previously shown that maternal diabetes profoundly affects gene expression in the developing embryo, in particular a suite of known NTD genes. In rodent experimental systems, NTDs present as phenotypes of incomplete penetrance in diabetic pregnancies. This property is difficult to reconcile with observations of consistently altered gene expression in exposed embryos. We here show that maternal diabetes increases the overall variability of gene expression levels in embryos.
Results: Altered gene expression and increased variability of gene expression together may constitute the molecular correlates for incomplete phenotype penetrance.
Discussion: Based on this model, we suggest that maternal diabetes reduces the precision of gene regulation in exposed individuals. Loss of precision in embryonic gene regulation may include changes to the epigenome via deregulated expression of chromatin-modifying factors. Unraveling the mechanisms underlying such epigenetic modifications in diabetic pregnancies will help to understand how teratogenic insults compromise embryonic development and possibly provide avenues for therapeutic intervention.
Figures

Similar articles
-
MicroRNA-322 overexpression reduces neural tube defects in diabetic pregnancies.Am J Obstet Gynecol. 2024 Feb;230(2):254.e1-254.e13. doi: 10.1016/j.ajog.2023.07.048. Epub 2023 Jul 31. Am J Obstet Gynecol. 2024. PMID: 37531989 Free PMC article.
-
The increased activity of a transcription factor inhibits autophagy in diabetic embryopathy.Am J Obstet Gynecol. 2019 Jan;220(1):108.e1-108.e12. doi: 10.1016/j.ajog.2018.10.001. Epub 2018 Oct 9. Am J Obstet Gynecol. 2019. PMID: 30312583 Free PMC article.
-
The green tea polyphenol EGCG alleviates maternal diabetes-induced neural tube defects by inhibiting DNA hypermethylation.Am J Obstet Gynecol. 2016 Sep;215(3):368.e1-368.e10. doi: 10.1016/j.ajog.2016.03.009. Epub 2016 Mar 12. Am J Obstet Gynecol. 2016. PMID: 26979632 Free PMC article.
-
Recent studies on neural tube defects in embryos of diabetic pregnancy: an overview.Curr Med Chem. 2009;16(18):2345-54. doi: 10.2174/092986709788453069. Curr Med Chem. 2009. PMID: 19519395 Review.
-
Genetic backgrounds and modifier genes of NTD mouse models: An opportunity for greater understanding of the multifactorial etiology of neural tube defects.Birth Defects Res. 2017 Jan 30;109(2):140-152. doi: 10.1002/bdra.23554. Birth Defects Res. 2017. PMID: 27768235 Review.
Cited by
-
A concerted metabolic shift in early forebrain alters the CSF proteome and depends on MYC downregulation for mitochondrial maturation.Development. 2019 Oct 24;146(20):dev182857. doi: 10.1242/dev.182857. Development. 2019. PMID: 31575649 Free PMC article.
-
Embryonic cell migratory capacity is impaired upon exposure to glucose in vivo and in vitro.Birth Defects Res. 2019 Aug 15;111(14):999-1012. doi: 10.1002/bdr2.1398. Epub 2018 Nov 19. Birth Defects Res. 2019. PMID: 30451383 Free PMC article.
-
Tip60- and sirtuin 2-regulated MARCKS acetylation and phosphorylation are required for diabetic embryopathy.Nat Commun. 2019 Jan 17;10(1):282. doi: 10.1038/s41467-018-08268-6. Nat Commun. 2019. PMID: 30655546 Free PMC article.
-
Roles of planar cell polarity pathways in the development of neural [correction of neutral] tube defects.J Biomed Sci. 2011 Aug 24;18(1):66. doi: 10.1186/1423-0127-18-66. J Biomed Sci. 2011. PMID: 21864354 Free PMC article. Review.
-
Mitochondria in Early Forebrain Development: From Neurulation to Mid-Corticogenesis.Front Cell Dev Biol. 2021 Nov 23;9:780207. doi: 10.3389/fcell.2021.780207. eCollection 2021. Front Cell Dev Biol. 2021. PMID: 34888312 Free PMC article. Review.
References
-
- Aberg A, Westbom L, Kallen B, et al. Congenital malformations among infants whose mothers had gestational diabetes or preexisting diabetes. Early Hum Dev. 2001;61:85–95. - PubMed
-
- Baelde HJ, Eikmans M, Doran PP, et al. Gene expression profiling in glomeruli from human kidneys with diabetic nephropathy. Am J Kidney Dis. 2004;43:636–650. - PubMed
-
- Chan BW, Chan KS, Koide T, et al. Maternal diabetes increases the risk of caudal regression caused by retinoic acid. Diabetes. 2002;51:2811–2816. - PubMed
-
- Chang TI, Loeken MR. Genotoxicity and diabetic embryopathy: impaired expression of developmental control genes as a cause of defective morphogenesis. Semin Reprod Endocrinol. 1999;17:153–165. - PubMed
Publication types
MeSH terms
Substances
Grants and funding
LinkOut - more resources
Full Text Sources
Other Literature Sources
Medical
