Review
. 2010 Jul-Aug;2(4):431-40.
doi: 10.1002/wnan.87.

Quantitative magnetic resonance fluorine imaging: today and tomorrow

Affiliations
Review

Quantitative magnetic resonance fluorine imaging: today and tomorrow

Junjie Chen et al. Wiley Interdiscip Rev Nanomed Nanobiotechnol. 2010 Jul-Aug.

Abstract

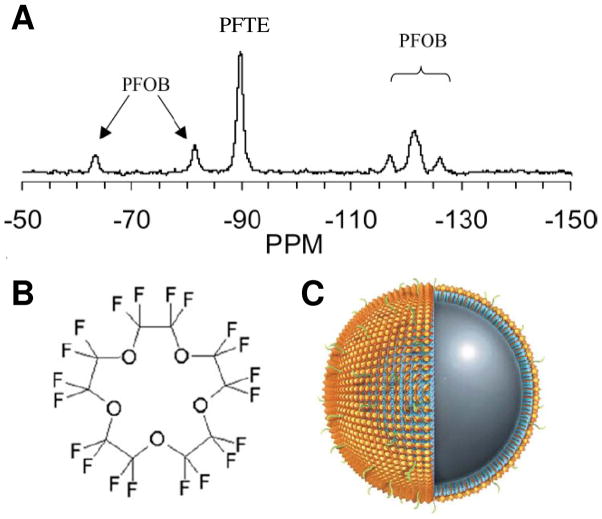
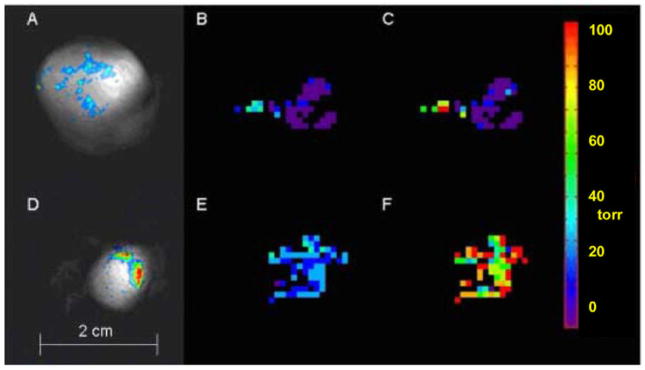
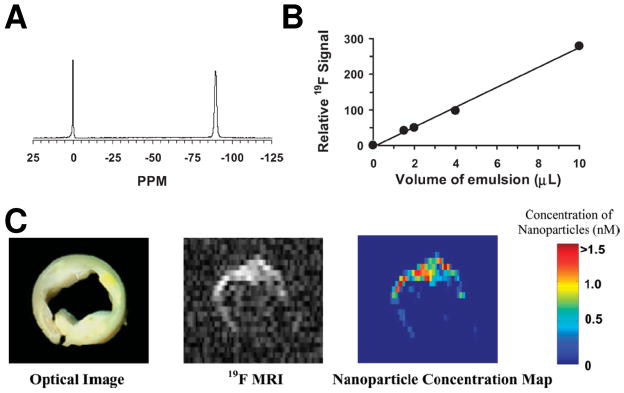
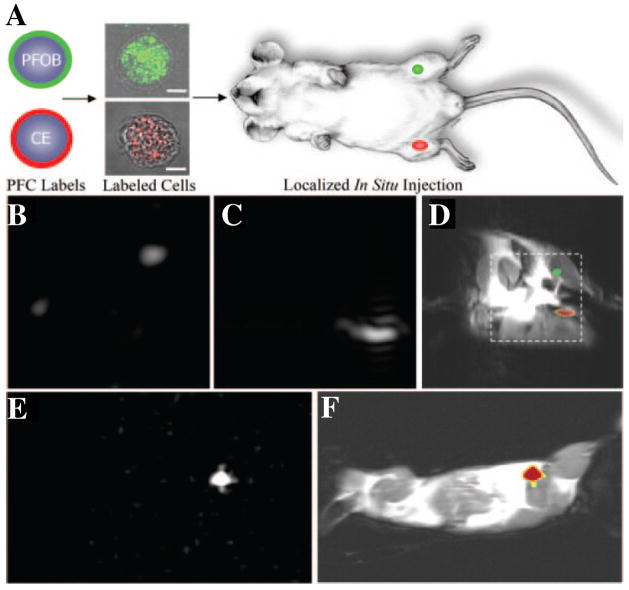
Fluorine (19F) is a promising moiety for quantitative magnetic resonance imaging (MRI). It possesses comparable magnetic resonance (MR) sensitivity to proton (1H) but exhibits no tissue background signal, allowing specific and selective assessment of the administrated 19F-containing compounds in vivo. Additionally, the MR spectra of 19F-containing compounds exhibited a wide range of chemical shifts (>200 ppm). Therefore, both MR parameters (e.g., spin-lattice relaxation rate R1) and the absolute quantity of molecule can be determined with 19F MRI for unbiased assessment of tissue physiology and pathology. This article reviews quantitative 19F MRI applications for mapping tumor oxygenation, assessing molecular expression in vascular diseases, and tracking labeled stem cells.


Figures

Figure 1
Figure 1
(A) Representative 19F spectrum of PFPE and PFOB nanoparticles shows the chemical shift of 19F signatures. The single PFPE peak and five discernible PFOB peaks are easily detected and individually resolved. (B) Chemical structure of PFPE shows its twenty 19F atoms. (C) Schematic of a PFPE nanoparticle functionalized with homing ligands in the outer phospholipid monolayer (shown in green). The PFPE nanoparticle provides 1H MR contrast by its surface payload of ~90,000 Gd3+ (shown in gold) and 19F MR contrast by ~100M 19F in its core. (From Morawski et al. [1] and Southworth et al. [2].)
Figure 2
Figure 2
FREDOM determined pO2 maps of two representative AT1 tumors in rats. The pO2 value was calculated pixel-by-pixel based on the quantified 19F R1 and a priori calibrated 19F R1 - pO2 curve of HFB. (A and D) Composite 19F (displayed in color) and 1H (displayed in grayscale) MR images show HFB distribution in a large tumor (A, 3.6 cm3) and a small tumor (D, 1 cm3). (B and E) Baseline pO2 maps show higher pO2 in the small tumor when both animals were breathing air. Mean pO2 of large and small tumors were 0.1 ± 1.8 torr and 25.4 ± 1.1 torr, respectively. (C and F) Tumor pO2 maps of same animals obtained at 24 minutes after oxygen breathing, mean pO2 of large and small tumors were 8.1 ± 4.5 torr and 90.6 ± 3.9 torr, respectively. Both values were significantly higher than that of baseline (p < 0.01). (From Bourke et al. [4].)
Figure 3
Figure 3
(A) A representative 19F spectrum of PFPE nanoparticle emulsion (−90 ppm) and trichlorofluormethane reference standard (0 ppm) acquired at 4.7 T. (B) The calibration curve for PFPE nanoparticle emulsion shows a linear relationship between the quantity of PFC nanoparticles and 19F signal intensity. (C) Left: An optical image of a human carotid endarterectomy sample shows moderate luminal narrowing and several atherosclerotic lesions. Middle: A 19F projection image acquired through the entire thickness of carotid artery sample shows high 19F signal along the lumen because of the binding of nanoparticles to fibrin. Right: The calculated concentration map of bound nanoparticles in the carotid sample based on 19F signal intensity in each voxel and the calibrated standard curve in (B). (From Morawski et al. [1].)
Figure 4
Figure 4
Diffusion weighted 19F signal in the ear of K14-HPV16 mice (open symbols), an animal model of squamous cell cancer with dysplastic lesions developed in the ear epidermis, and in the ear of control C57BL/6 mice (filled symbols). All animals were intravenously injected with of αvβ3-integrin targeted PFC nanoparticles before MRI. (A) Results acquired with modest b-values (i.e., an index of diffusion weighting) shows complete decay of 19F signal in control mouse ears when b-value > 1500 s/mm2. In contrast, a large fraction of 19F signal persisted in the ears of K14-HPV16 mice at all b-values, reflecting the specific binding of targeted nanoparticles to the ear neovasculature of K14-HPV16 mice. (B) Diffusion weighted 19F signal in the ears of K14-HPV16 mice persisted even when b-values > 10,000 s/mm2. (From Waters et al. [5].)
Figure 5
Figure 5
Localization of PFC nanoparticles labeled cells in mice using 19F MRI. (A) 19F MRI trafficking of stem/progenitor cells labeled with either PFOB (green) or PFPE (red) nanoparticles. Labeled cells were locally injected into the skeletal muscle of mouse thigh before MRI. (B–D) At 11.7T field strength, 19F spectral discrimination permits respective imaging of ~1×10⁶ PFOB-loaded cells (B) and PFPE-loaded cells (C). The composite 19F (displayed in color) and 1H (displayed in grayscale) image (D) reveals the location of PFOB labeled cells in the left leg and PFPE labeled cells in the right leg (dashed line indicates 3×3 cm2 field of view for 19F images). (E) Similarly, a 19F image acquired at 1.5T field strength shows 19F signal from ~4×10⁶ PFPE nanoparticles labeled cells. (F) The composite 19F and 1H image shows the location of PFPE nanoparticles labeled cells in a mouse thigh. Overall, the absence of background signal in 19F images (B, C, and E) enables unambiguous localization of PFC-containing cells at both 1.5 T and 11.7 T field strength. (From Partlow et al. [3].)

References

    1. Morawski AM, Winter PM, Yu X, Fuhrhop RW, Scott MJ, Hockett F, Robertson JD, Gaffney PJ, Lanza GM, Wickline SA. Quantitative “magnetic resonance immunohistochemistry” with ligand-targeted (19)F nanoparticles. Magn Reson Med. 2004;52(6):1255–1262. - PubMed
    1. Southworth R, Kaneda M, Chen J, Zhang L, Zhang H, Yang X, Razavi R, Lanza G, Wickline SA. Renal vascular inflammation induced by Western diet in ApoE-null mice quantified by (19)F NMR of VCAM-1 targeted nanobeacons. Nanomedicine. 2009;5(3):359–367. - PMC - PubMed
    1. Partlow KC, Chen J, Brant JA, Neubauer AM, Meyerrose TE, Creer MH, Nolta JA, Caruthers SD, Lanza GM, Wickline SA. 19F magnetic resonance imaging for stem/progenitor cell tracking with multiple unique perfluorocarbon nanobeacons. FASEB J. 2007;21(8):1647–1654. - PubMed
    1. Bourke VA, Zhao D, Gilio J, Chang CH, Jiang L, Hahn EW, Mason RP. Correlation of radiation response with tumor oxygenation in the Dunning prostate R3327-AT1 tumor. Int J Radiat Oncol Biol Phys. 2007;67(4):1179–1186. - PMC - PubMed
    1. Waters EA, Chen J, Yang X, Zhang H, Neumann R, Santeford A, Arbeit J, Lanza GM, Wickline SA. Detection of targeted perfluorocarbon nanoparticle binding using 19F diffusion weighted MR spectroscopy. Magn Reson Med. 2008;60(5):1232–1236. - PMC - PubMed