

A robust methodology for in vivo T1 mapping
- PMID: 20564597
- PMCID: PMC2962940
- DOI: 10.1002/mrm.22497
A robust methodology for in vivo T1 mapping
Abstract
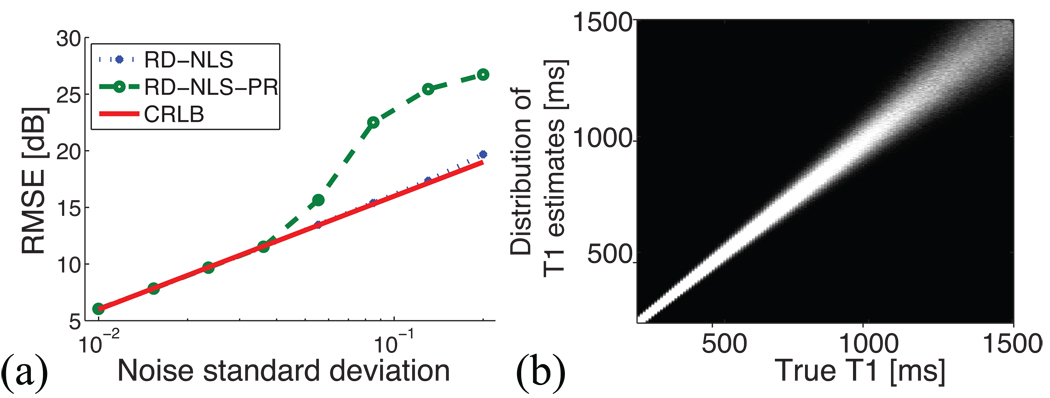
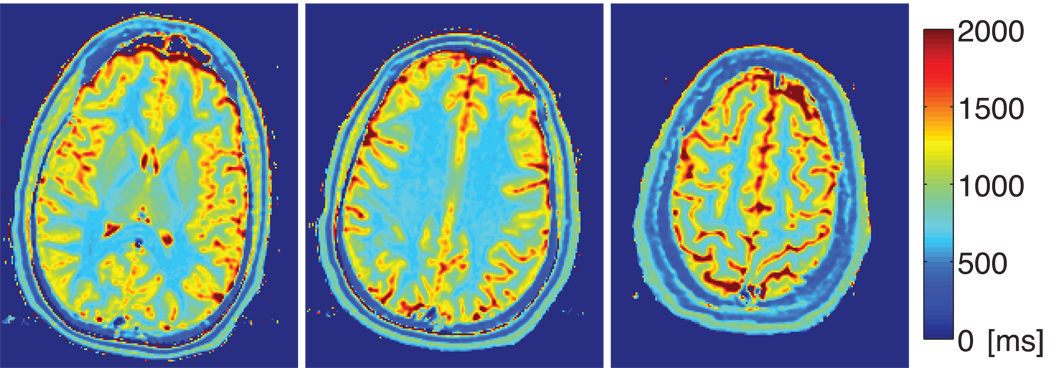
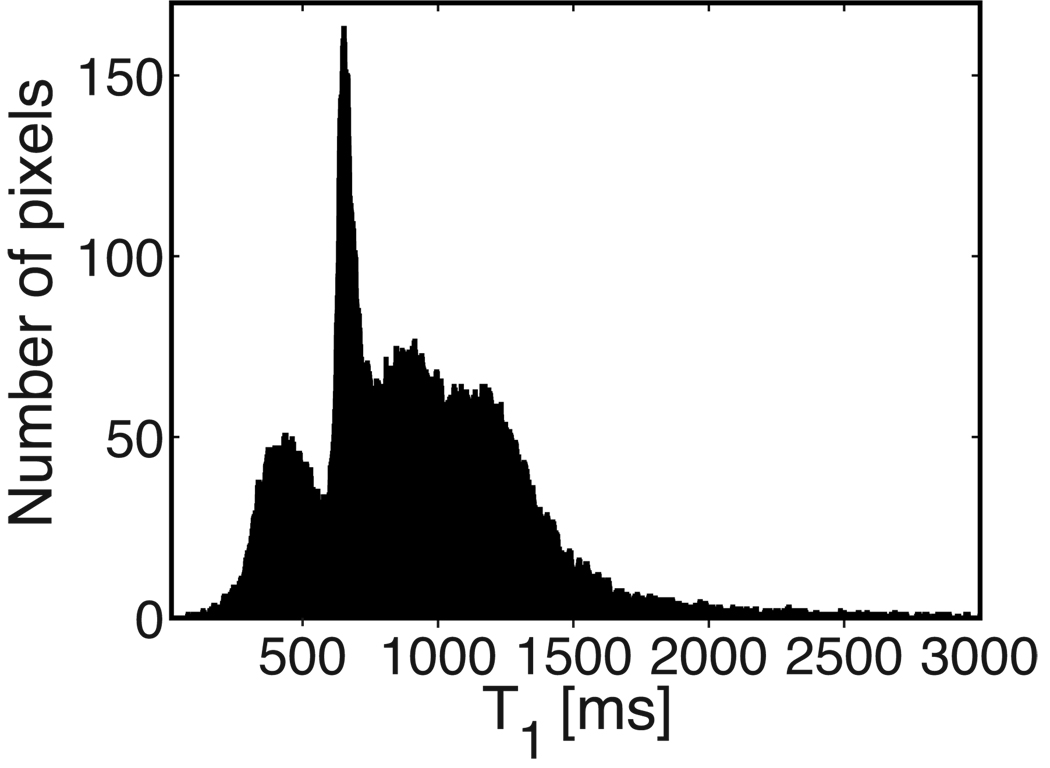
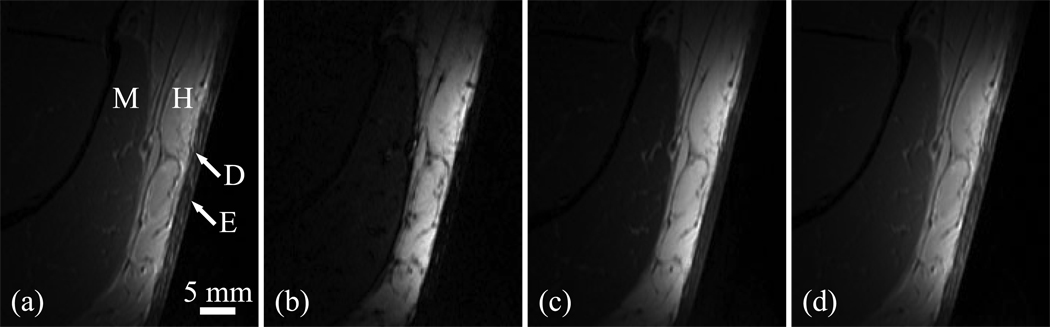
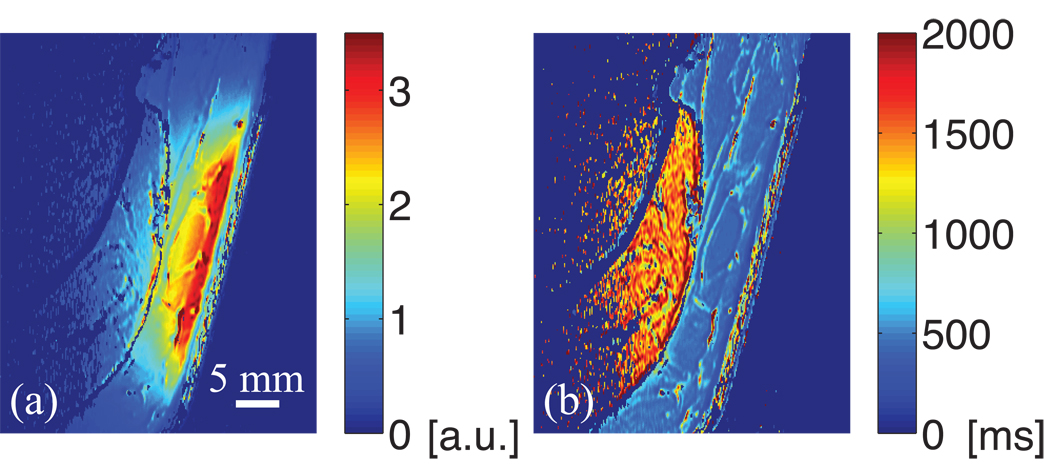
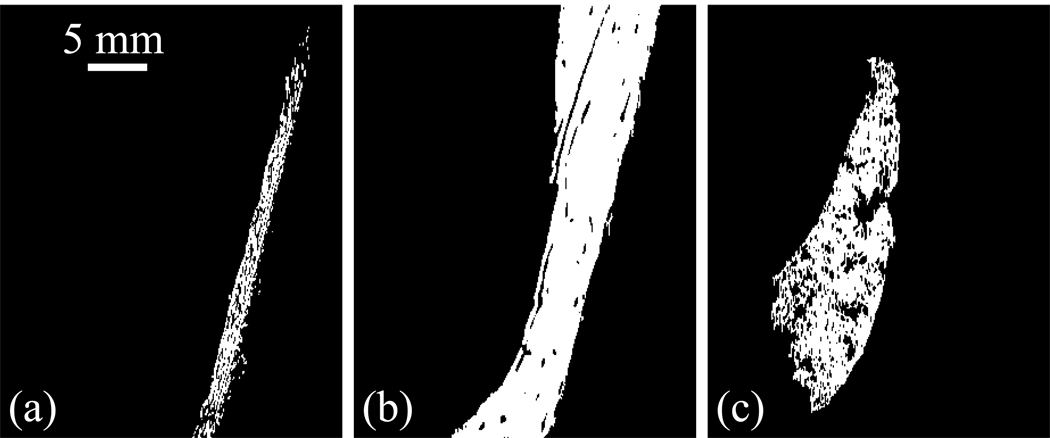
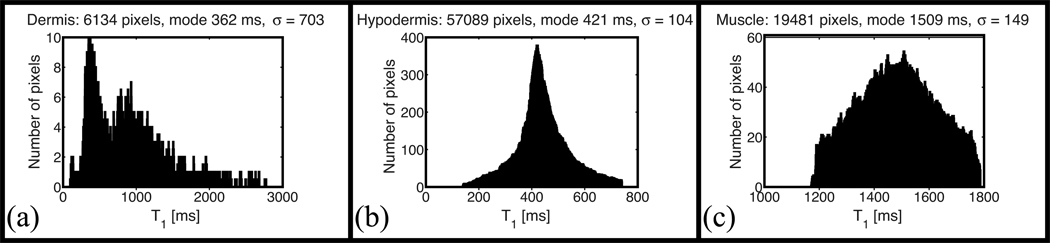
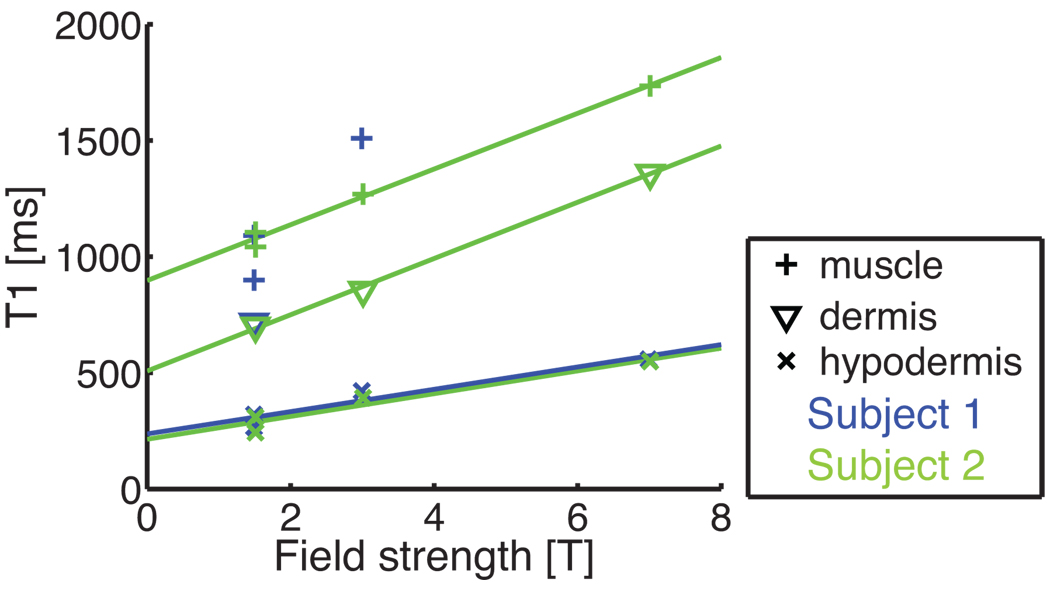
In this article, a robust methodology for in vivo T(1) mapping is presented. The approach combines a gold standard scanning procedure with a novel fitting procedure. Fitting complex data to a five-parameter model ensures accuracy and precision of the T(1) estimation. A reduced-dimension nonlinear least squares method is proposed. This method turns the complicated multi-parameter minimization into a straightforward one-dimensional search. As the range of possible T(1) values is known, a global grid search can be used, ensuring that a global optimal solution is found. When only magnitude data are available, the algorithm is adapted to concurrently restore polarity. The performance of the new algorithm is demonstrated in simulations and phantom experiments. The new algorithm is as accurate and precise as the conventionally used Levenberg-Marquardt algorithm but much faster. This gain in speed makes the use of the five-parameter model viable. In addition, the new algorithm does not require initialization of the search parameters. Finally, the methodology is applied in vivo to conventional brain imaging and to skin imaging. T(1) values are estimated for white matter and gray matter at 1.5 T and for dermis, hypodermis, and muscle at 1.5 T, 3 T, and 7 T.
Figures
References
-
- Kingsley PB. Methods of measuring spin-lattice (T1) relaxation times: An annotated bibliography. Concepts Magn Reson. 1999;11:243–276.
-
- Tofts P. Quantitative MRI of the brain: measuring changes caused by disease. West Sussex: Wiley, Chichester; 2003.
-
- Drain LE. A direct method of measuring nuclear spin-lattice relaxation times. Proc Phys Soc Lond A. 1949;62:301.
-
- Hahn EL. An accurate nuclear magnetic resonance method for measuring spin-lattice relaxation times. Phys Rev. 1949;76:145–146.
-
- Bevington PR. Data reduction and error analysis for the physical sciences. New York: McGraw-Hill; 1969. pp. 235–236.
Publication types
MeSH terms
Grants and funding
LinkOut - more resources
Full Text Sources
Other Literature Sources
Medical
