

Improving temporal resolution of pulmonary perfusion imaging in rats using the partially separable functions model
- PMID: 20564601
- PMCID: PMC2946504
- DOI: 10.1002/mrm.22500
Improving temporal resolution of pulmonary perfusion imaging in rats using the partially separable functions model
Abstract
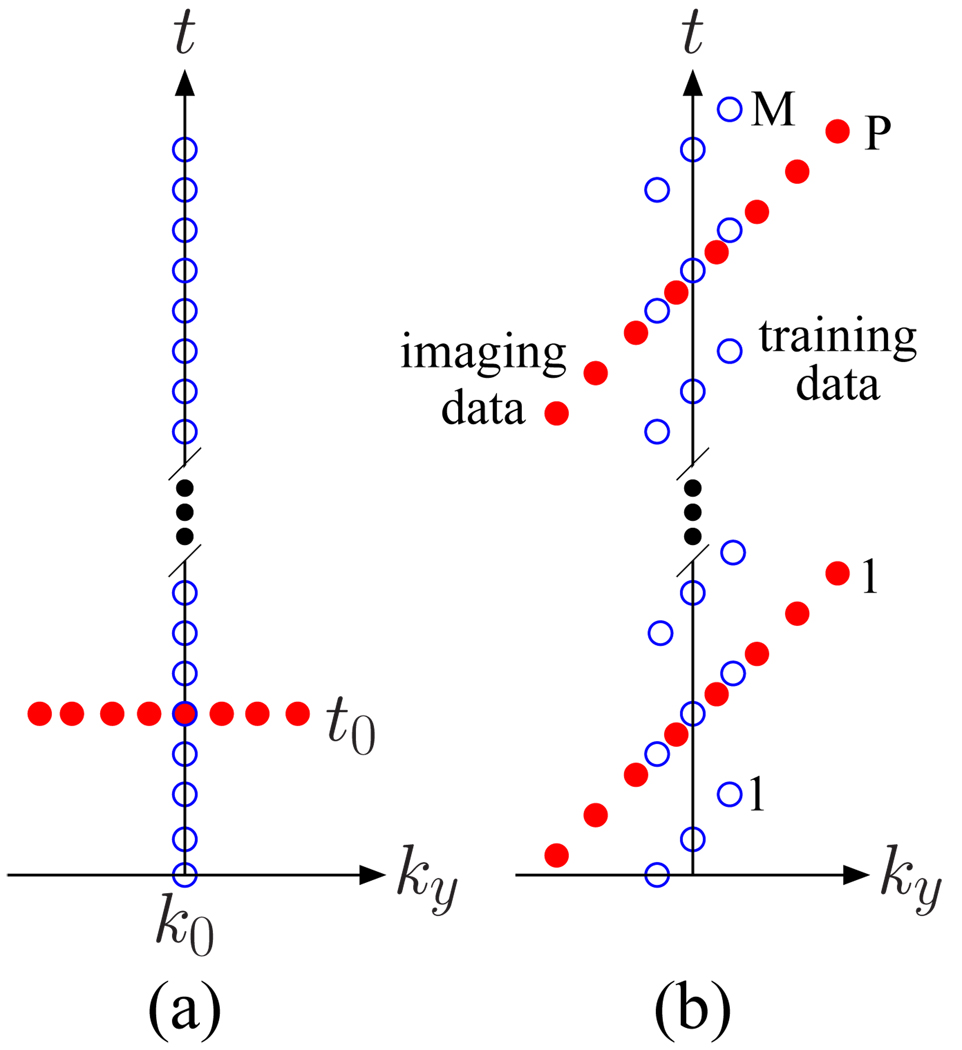
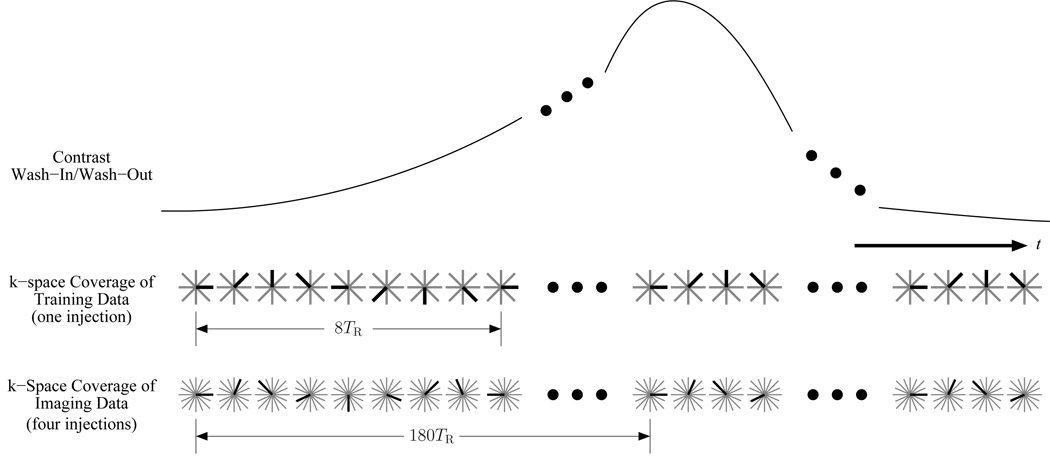
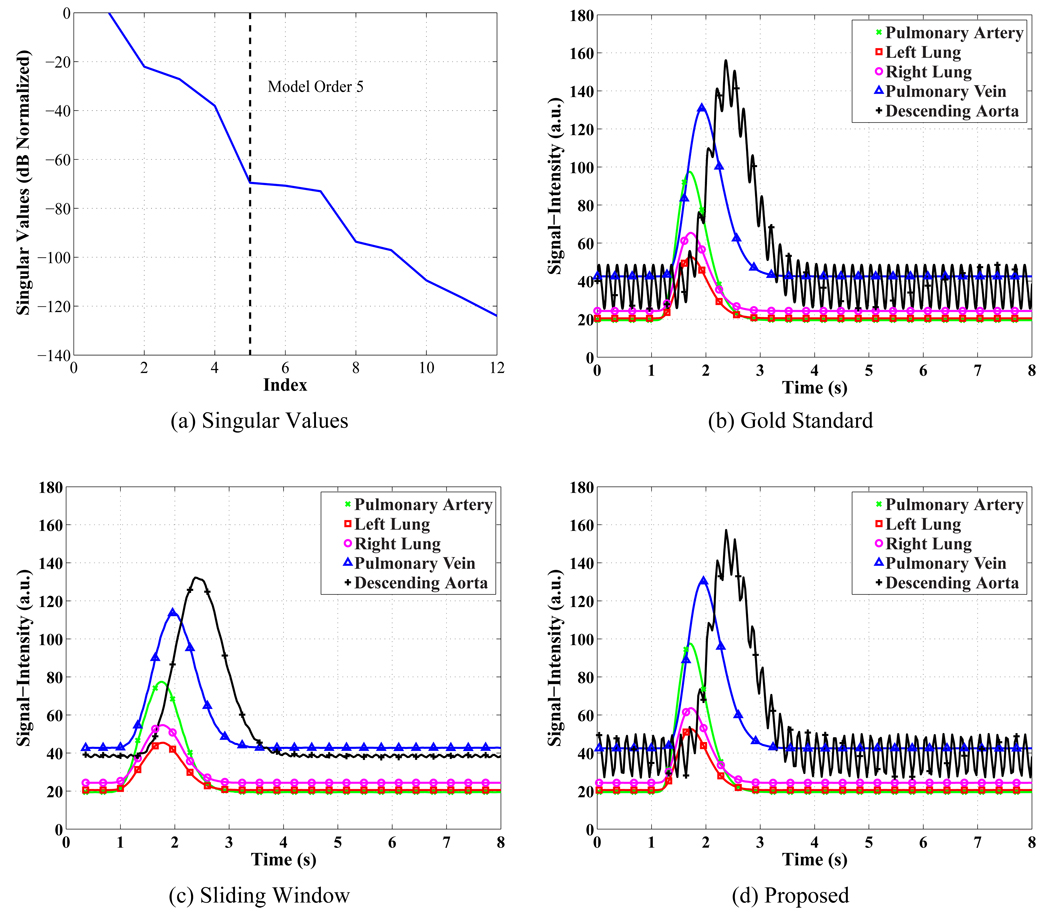
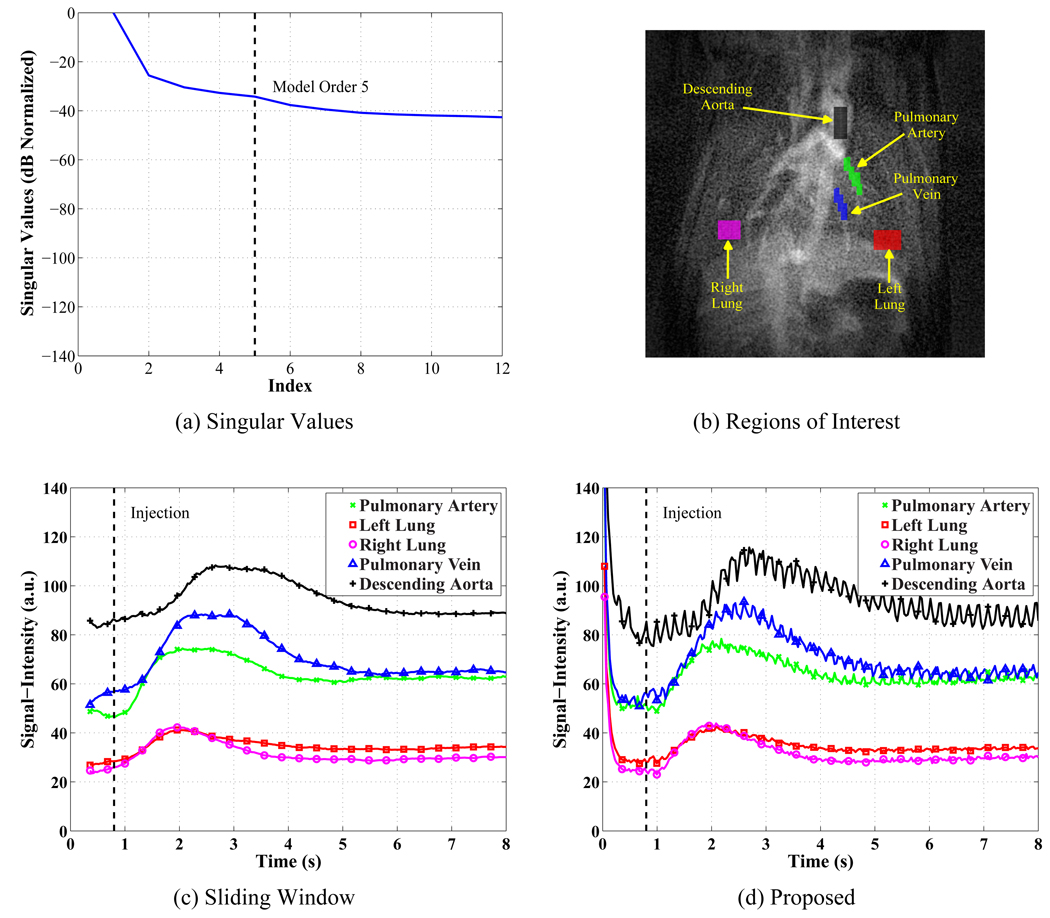
Dynamic contrast-enhanced MRI (or DCE-MRI) is a useful tool for measuring blood flow and perfusion, and it has found use in the study of pulmonary perfusion in animal models. However, DCE-MRI experiments are difficult in small animals such as rats. A recently developed method known as Interleaved Radial Imaging and Sliding window-keyhole (IRIS) addresses this problem by using a data acquisition scheme that covers (k,t)-space with data acquired from multiple bolus injections of a contrast agent. However, the temporal resolution of IRIS is limited by the effects of temporal averaging inherent in the sliding window and keyhole operations. This article describes a new method to cover (k,t)-space based on the theory of partially separable functions (PSF). Specifically, a sparse sampling of (k,t)-space is performed to acquire two data sets, one with high-temporal resolution and the other with extended k-space coverage. The high-temporal resolution training data are used to determine the temporal basis functions of the PSF model, whereas the other data set is used to determine the spatial variations of the model. The proposed method was validated by simulations and demonstrated by an experimental study. In this particular study, the proposed method achieved a temporal resolution of 32 msec.
Figures
References
-
- Thompson HK, Starmer CF, Whalen RE, McIntosh HD. Indicator Transit Time Considered as a Gamma Variate. Circ Res. 1964;14:502–515. - PubMed
-
- Berthezene Y, Vexler V, Clement O, Muhler A, Moseley ME, Brasch RC. Contrast-enhanced MR imaging of the lung: assessments of ventilation and perfusion. Radiology. 1992;183:667–672. - PubMed
-
- Presson RG, Todoran TM, B J DeWitt IFM, Wagner WW. Capillary Recruitment and Transit Time in the Rat Lung. J Appl Physiology. 1997;83:543–549. - PubMed
-
- Balogh L, Andoncs G, Thuroczy J, Nemeth T, Lang J, Bodoi K, Janoki GA. Veterinary Nuclear Medicine. Scintigraphical Examinations - a Review. Acta Vet Brno. 1999;68:231–239.
-
- Hatabu H, Tadamura E, Levin DL, Chen Q, Li W, Kim D, Prasad PV. Quantitative Assessment of Pulmonary Perfusion with Dynamic Contrast-Enhanced MRI. Magn Reson Med. 1999;42:1033–1038. - PubMed
Publication types
MeSH terms
Grants and funding
LinkOut - more resources
Full Text Sources
