

Development and evaluation of an open source Delphi-based software for morphometric quantification of liver fibrosis
- PMID: 20565730
- PMCID: PMC2903497
- DOI: 10.1186/1755-1536-3-10
Development and evaluation of an open source Delphi-based software for morphometric quantification of liver fibrosis
Abstract
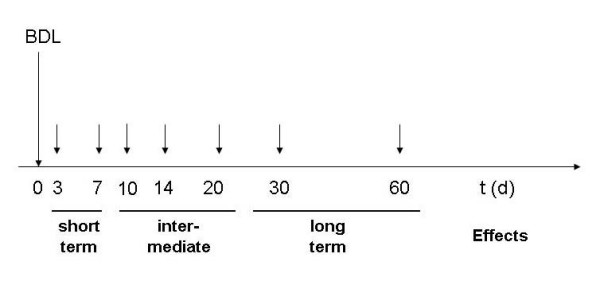
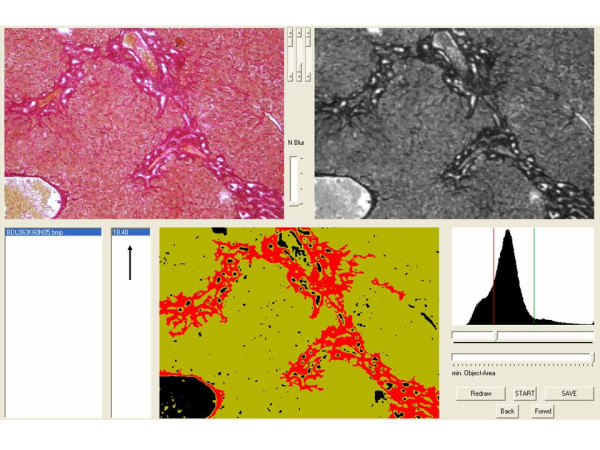
Background: Computer-based morphometry can minimize subjectivity in the assessment of liver fibrosis. An image processing program was developed with Delphi for the quantification of fibrosis in liver tissue samples stained with Sirius Red. Bile duct ligated and sham operated wild type C57BL/6 mice served as a model of time-dependent induction of liver fibrosis. Formation of fibrosis was determined with the developed software at day 0, 3, 7, 10, 14, 20, 30 and 60. The results were compared to a semi-quantitative scoring system.
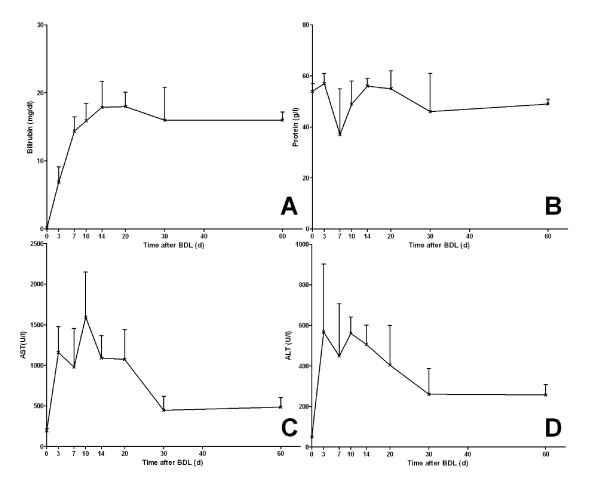
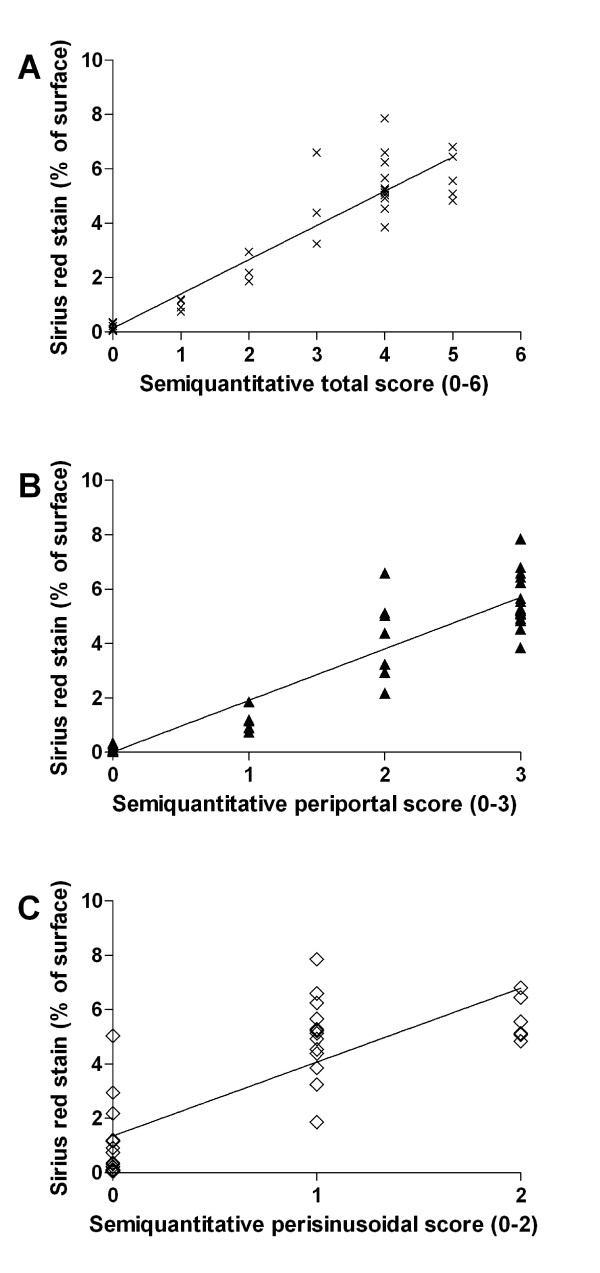
Results: Quantitative accumulation of collagen fibres was observed from day 3 to day 14, with a slight further increase thereafter. During ongoing fibrogenesis, there was a significant elevation of alanine aminotransferase (ALT), aspartate transaminase (AST) and bilirubin. The results from our computer-based morphometric analysis were highly correlated with the results that were obtained in a standardized pathology semi-quantitative scoring system (R 2 = 0.89, n = 38).
Conclusions: Using our Delphi-based image analysing software, the morphometric assessment of fibrosis is as precise as semi-quantitative scoring by an experienced pathologist. This program can be a valuable tool in any kind of experimental or clinical setting for standardized quantitative assessment of fibrosis.
Figures


Similar articles
-
Effect of pentoxifylline in rat and swine models of hepatic fibrosis: role of fibroproliferation in its mechanism.Immunopharmacology. 1996 Mar;31(2-3):183-93. doi: 10.1016/0162-3109(95)00048-8. Immunopharmacology. 1996. PMID: 8861744
-
Quantitative assessment of fibrosis in liver biopsies from patients with chronic hepatitis B.Liver Int. 2004 Dec;24(6):611-8. doi: 10.1111/j.1478-3231.2004.0957.x. Liver Int. 2004. PMID: 15566512
-
In vivo inefficiency of pentoxifylline and interferon-alpha on hepatic fibrosis in biliary-obstructed rats: assessment by tissue collagen content and prolidase activity.J Gastroenterol Hepatol. 2003 Apr;18(4):437-44. doi: 10.1046/j.1440-1746.2003.03004.x. J Gastroenterol Hepatol. 2003. PMID: 12653893
-
Fas enhances fibrogenesis in the bile duct ligated mouse: a link between apoptosis and fibrosis.Gastroenterology. 2002 Oct;123(4):1323-30. doi: 10.1053/gast.2002.35953. Gastroenterology. 2002. PMID: 12360492
-
[Recent approaches of quantification of interstitial fibrosis in renal transplantation].Med Sci (Paris). 2009 Nov;25(11):945-50. doi: 10.1051/medsci/20092511945. Med Sci (Paris). 2009. PMID: 19951669 Review. French.
Cited by
-
Angiotensin-II type 1 receptor-mediated Janus kinase 2 activation induces liver fibrosis.Hepatology. 2014 Jul;60(1):334-48. doi: 10.1002/hep.27117. Epub 2014 May 6. Hepatology. 2014. PMID: 24619965 Free PMC article.
-
Statins activate the canonical hedgehog-signaling and aggravate non-cirrhotic portal hypertension, but inhibit the non-canonical hedgehog signaling and cirrhotic portal hypertension.Sci Rep. 2015 Sep 28;5:14573. doi: 10.1038/srep14573. Sci Rep. 2015. PMID: 26412302 Free PMC article.
-
Role of Chymase in the Development of Liver Cirrhosis and Its Complications: Experimental and Human Data.PLoS One. 2016 Sep 16;11(9):e0162644. doi: 10.1371/journal.pone.0162644. eCollection 2016. PLoS One. 2016. PMID: 27637026 Free PMC article.
-
Deficiency in four and one half LIM domain protein 2 (FHL2) aggravates liver fibrosis in mice.BMC Gastroenterol. 2013 Jan 14;13:8. doi: 10.1186/1471-230X-13-8. BMC Gastroenterol. 2013. PMID: 23311569 Free PMC article.
-
In Vivo and In Vitro Models to Study Liver Fibrosis: Mechanisms and Limitations.Cell Mol Gastroenterol Hepatol. 2023;16(3):355-367. doi: 10.1016/j.jcmgh.2023.05.010. Epub 2023 Jun 1. Cell Mol Gastroenterol Hepatol. 2023. PMID: 37270060 Free PMC article. Review.
References
-
- Portmann BC, Nakanuma Y, editor. Diseases of the Bile Ducts. 5. New York: Churchill Livingstone; 2007.
-
- Caballero T, Perez-Milena A, Masseroli M, O'Valle F, Salmeron FJ, Del Moral RM, Sanchez-Salgado G. Liver fibrosis assessment with semiquantitative indexes and image analysis quantification in sustained-responder and non-responder interferon-treated patients with chronic hepatitis C. J Hepatol. 2001;34:740–747. doi: 10.1016/S0168-8278(01)00006-X. - DOI - PubMed
LinkOut - more resources
Full Text Sources
