Comparative Study
. 2010 Jun 17:4:86.
doi: 10.1186/1752-0509-4-86.

Comparative analysis of cis-regulation following stroke and seizures in subspaces of conserved eigensystems

Affiliations
Comparative Study

Comparative analysis of cis-regulation following stroke and seizures in subspaces of conserved eigensystems

Michal Dabrowski et al. BMC Syst Biol. .

Abstract

Background: It is often desirable to separate effects of different regulators on gene expression, or to identify effects of the same regulator across several systems. Here, we focus on the rat brain following stroke or seizures, and demonstrate how the two tasks can be approached simultaneously.

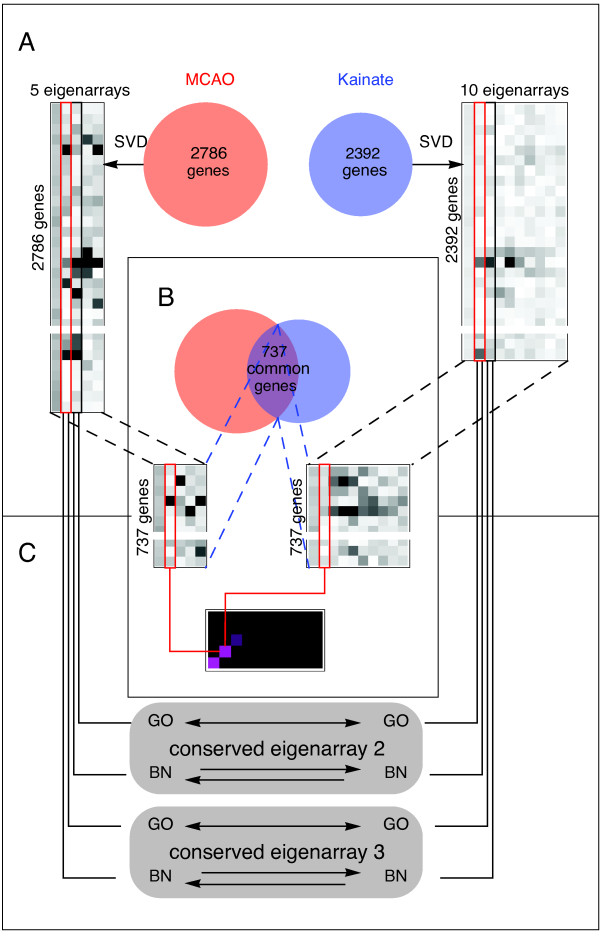
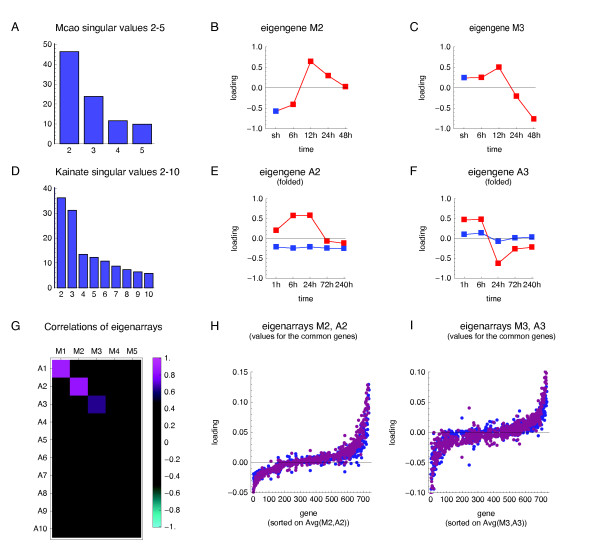
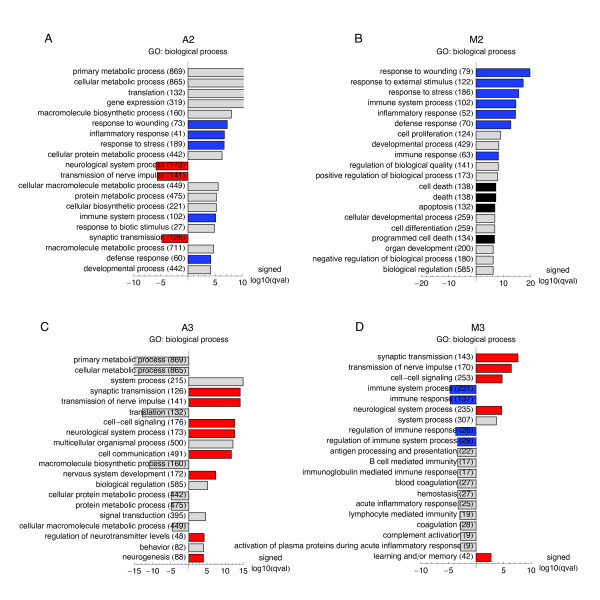
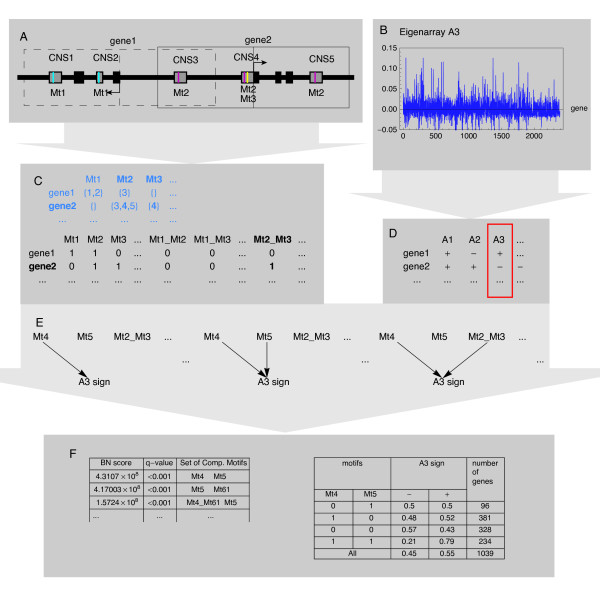
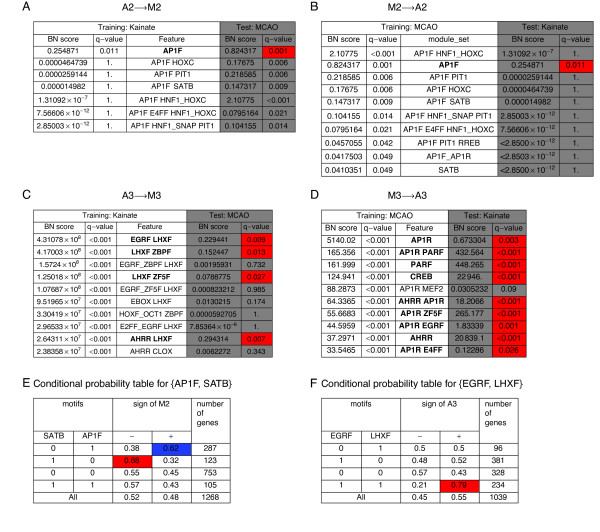
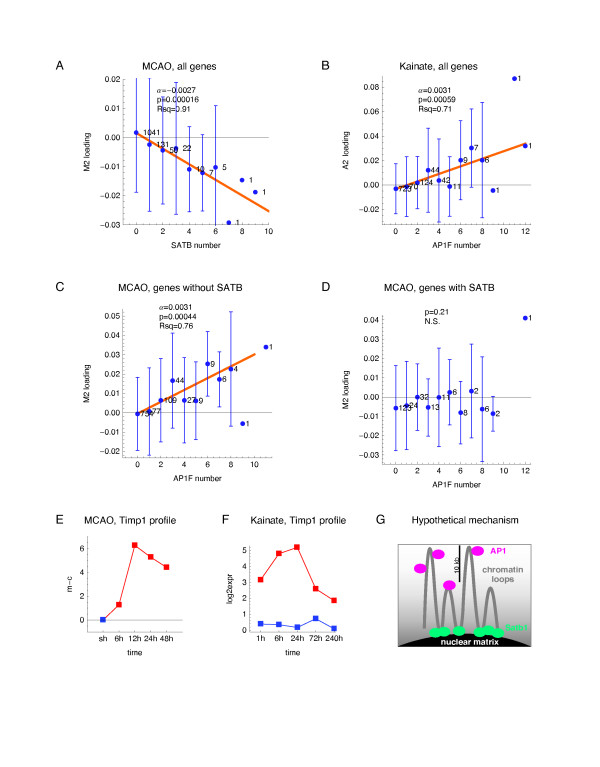
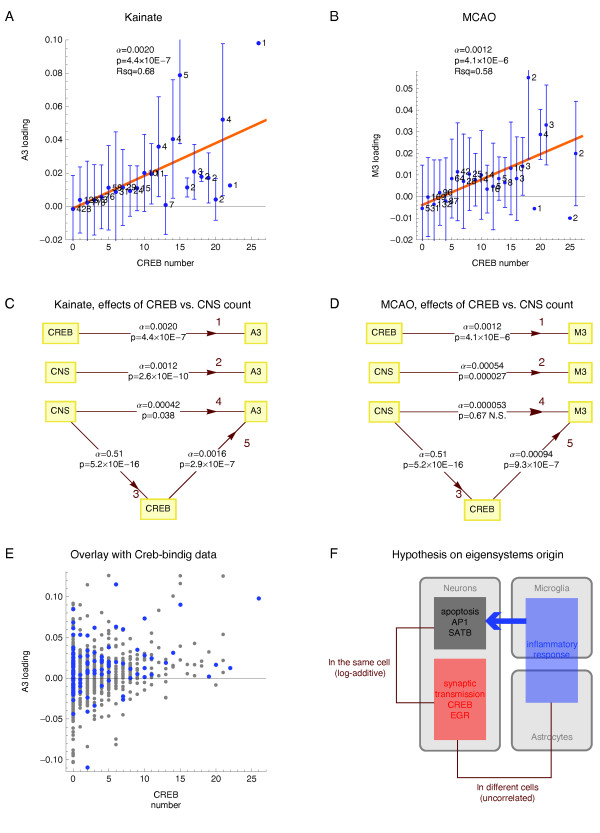
Results: We applied SVD to time-series gene expression datasets from the rat experimental models of stroke and seizures. We demonstrate conservation of two eigensystems, reflecting inflammation and/or apoptosis (eigensystem 2) and neuronal synaptic activity (eigensystem 3), between the stroke and seizures. We analyzed cis-regulation of gene expression in the subspaces of the conserved eigensystems. Bayesian networks analysis was performed separately for either experimental model, with cross-system validation of the highest-ranking features. In this way, we correctly re-discovered the role of AP1 in the regulation of apoptosis, and the involvement of Creb and Egr in the regulation of synaptic activity-related genes. We identified a novel antagonistic effect of the motif recognized by the nuclear matrix attachment region-binding protein Satb1 on AP1-driven transcriptional activation, suggesting a link between chromatin loop structure and gene activation by AP1. The effects of motifs binding Satb1 and Creb on gene expression in brain conform to the assumption of the linear response model of gene regulation. Our data also suggest that numerous enhancers of neuronal-specific genes are important for their responsiveness to the synaptic activity.

Conclusion: Eigensystems conserved between stroke and seizures separate effects of inflammation/apoptosis and neuronal synaptic activity, exerted by different transcription factors, on gene expression in rat brain.


Figures

Figure 1
Figure 1
Design of the study (A) The datasets from gene profiling of rat brain following stroke in the MCAO model and kainate-induced seizures were each separately transformed by SVD. (B) The eigenarrays resulting from the SVD of either dataset were compared by correlation analysis performed for the genes common between the two datasets. (C) For the emerging conserved eigensystems 2 and 3, separately for all the genes in either dataset, we studied their functional Gene Ontology (GO) associations and employed Bayesian Networks (BN) to study their cis-regulation. The results obtained on one dataset were then compared (GO) or statistically tested (BN) on the other.
Figure 2
Figure 2
Comparative SVD analysis of gene expression following ischemia and seizures. The MCAO and kainate dataset were each separately transformed by SVD and the results were compared. (A, D) The singular values plotted as bars. The large singular values for the respective first eigensystems reflecting the magnitude (constant in time) are omitted for clarity. (B-C, E-F) The two most important non-constant eigengenes in the MCAO system (M2, M3) and in the kainate system (A2, A3). Red squares indicate loadings on the conditions of treatment, blue - control. The eigengenes A2 and A3, which are vectors of length 10, have been folded in (E-F), to match the loadings onto the same time-points following the injection of kainate and saline. (G) Correlations between eigenarrays from either system for the 737 common genes. (H-I) Loadings of the respective second (H) and third (I) eigensystems, in the MCAO (blue) and kainate (violet) model, to the expression profiles of the 737 common genes. The genes were sorted on each gene's average loading of M2 and A2 (H) or of M3 and A3 (I).
Figure 3
Figure 3
Functional Gene Ontology annotations associated with the conserved eigensystems (A-D) Association of loadings of the conserved eigensystems with the functional annotations from the GO "biological process" ontology were analyzed by Wilcoxon sign rank test using RankGOstat [55]. Twenty GO terms most associated with a given eigensystem, and their association FDR q-values are shown as bar plots. For the plots the q-values were log10-transformed and multiplied by +1 or -1, to reflect association with the positive or negative loadings of a particular eigensystem. GO terms with overlapping meanings (identified by human inspection) are indicated by the same colour of the bars, with red marking terms related to "synaptic transmission", blue marking terms similar to "inflammatory response", and black marking terms describing cell death/apoptosis.
Figure 4
Figure 4
Bayesian network model of fragmented cis-regulatory regions (A, C) Sequence preprocessing consists of extracting instances of composite motifs i.e. sets of (up to three motifs) in the same conserved non-coding sequence (CNS), from the flanks of transcription start sites of all human-rat orthologous genes. (B, D) Expression data preprocessing consists of SVD, followed by discretization of expression into up- and down-regulation in the subspace of a particular conserved eigensystem - based on the sign of its loading. (C, D) Composite motifs and expression data are combined in one dataset, in which the data records correspond to genes. (E) This dataset becomes an input for our Bayesian networks (BN) learning algorithm, which identifies sets of composite motifs most associated with the sign of loadings of a given eigensystem. (F) The final output consists of a ranking of such sets, with conditional probability distributions representing their impact on a given eigensystem. BN learning was performed independently for each of the eigensystems: A2, A3, M2, M3; on the data for all the genes in the respective dataset. Eigensystem A3 is shown as an example.
Figure 5
Figure 5
BN analysis of cis-regulation for the conserved eigensystems. The four tables (A-D) present the results of BN analysis of cis-regulation for the conserved second and third eigensystems from either dataset, followed by testing of highest-ranking features on the corresponding eigensystem from the other dataset. In each panel, the column Feature lists up to 10 nonempty sets of composite motifs with highest BN score and q-value < 0.05 on the indicated training dataset. Note that single motifs are included in the set of composite motifs. BN score of a composite motif set is the ratio of its posterior probability to the posterior probability of the empty set. The corresponding q-value derives from the permutational test. The shaded columns give the values of BN score and the corresponding q-value for the same feature computed on the other (test) dataset. Red color marks the cells with the test q-values < 0.05 for the features that also had training q-value < 0.05 and the descriptions of such features are given in bold. The q-values take into account the multiplicity of testing for each dataset separately, so it is possible to identify the features significant for one dataset only. (E, F) The conditional probability tables for the pairs of motifs: {AP1F, SATB} (E) and {EGRF, LHXF} (F).
Figure 6
Figure 6
Effects of motifs binding AP1 and Satb1 on gene expression in the subspace of conserved eigensystem 2. The effects of motif count per gene on the loadings of the indicated eigensystem were analyzed by weighted linear regression. The response variable was the average loadings of a given eigensystem in groups of genes with the same count of the motif used as the regressor variable, with the weights equal to the numbers of genes per group. The average loadings for each motif count are indicated as blue dots, with their standard deviations shown as error bars, and the group gene count plotted next to each fitted data point. (A) The effect of SATB count on the loadings of eigensystem M2. (B) The effect of AP1F count on the loadings of eigensystem A2. (C) The effect of AP1F count on the loadings of eigensystem M2 analyzed for the genes without SATB motif. (D) The effect of AP1F count on the loadings of eigensystem M2 analyzed for the genes with SATB motif. (E-F) The log-expression profiles of Timp1 in the MCAO and kainate system. (G) A hypothetical mechanism, by which binding to the nuclear matrix via Satb1 makes a gene less accessible for binding or activation by AP1.
Figure 7
Figure 7
Effects of CREB motif count on gene expression in the subspace of the conserved eigensystem 3 (A, B) The effects of CREB motif count per gene on the average loadings of the eigensystem A3 or M3 analyzed by weighted linear regression, as described in the legend to Figure 6. (C, D) Effect of CREB count and direct and indirect (via CREB count) effect of CNS count per gene on the average loadings of eigensystems A3 or M3 analyzed by weighted linear regression, either univariate (edges 1, 2, 3) or bivariate (edges 4, 5), in groups of genes with the same numbers of CNSs, CREB motifs, or both. The results are represented as path analysis graphs, with each edge marked by the values of the respective linear regression directional coefficient α and its corresponding t-test p-value. In the univariate regression of CREB count on CNS count (edge 3) the data for all the genes with at least one CNS in the TRAM database were used. (E) The single gene A3 loadings and CREB counts for all the genes with CNS(s) in the kainate dataset (grey dots) compared to the values the Creb-binding genes in PC12 cells identified by genome-wide ChIP analysis by Impey et al. [50] (blue dots). (F) Uncorrelated, additive effects of the motifs SATB and CREB on gene log-expression provide an insight into the biology of the MCAO system.

Similar articles

Cited by

References

    1. Dirnagl U, Iadecola C, Moskowitz MA. Pathobiology of ischaemic stroke: an integrated view. Trends in neurosciences. 1999;22:391–397. doi: 10.1016/S0166-2236(99)01401-0. - DOI - PubMed
    1. Wang Q, Yu S, Simonyi A, Sun GY, Sun AY. Kainic acid-mediated excitotoxicity as a model for neurodegeneration. Molecular neurobiology. 2005;31:3–16. doi: 10.1385/MN:31:1-3:003. - DOI - PubMed
    1. Tang Y, Lu A, Aronow BJ, Wagner KR, Sharp FR. Genomic responses of the brain to ischemic stroke, intracerebral haemorrhage, kainate seizures, hypoglycemia, and hypoxia. The European journal of neuroscience. 2002;15:1937–1952. doi: 10.1046/j.1460-9568.2002.02030.x. - DOI - PubMed
    1. Alter O, Brown PO, Botstein D. Singular value decomposition for genome-wide expression data processing and modeling. Proceedings of the National Academy of Sciences of the United States of America. 2000;97:10101–10106. doi: 10.1073/pnas.97.18.10101. - DOI - PMC - PubMed
    1. Holter NS, Mitra M, Maritan A, Cieplak M, Banavar JR, Fedoroff NV. Fundamental patterns underlying gene expression profiles: simplicity from complexity. Proceedings of the National Academy of Sciences of the United States of America. 2000;97:8409–8414. doi: 10.1073/pnas.150242097. - DOI - PMC - PubMed

Publication types

Substances