

Polycomb repressor complex 2 regulates HOXA9 and HOXA10, activating ID2 in NK/T-cell lines
- PMID: 20565746
- PMCID: PMC2894765
- DOI: 10.1186/1476-4598-9-151
Polycomb repressor complex 2 regulates HOXA9 and HOXA10, activating ID2 in NK/T-cell lines
Abstract
Background: NK- and T-cells are closely related lymphocytes, originating from the same early progenitor cells during hematopoiesis. In these differentiation processes deregulation of developmental genes may contribute to leukemogenesis. Here, we compared expression profiles of NK- and T-cell lines for identification of aberrantly expressed genes in T-cell acute lymphoblastic leukemia (T-ALL) which physiologically regulate the differentiation program of the NK-cell lineage.
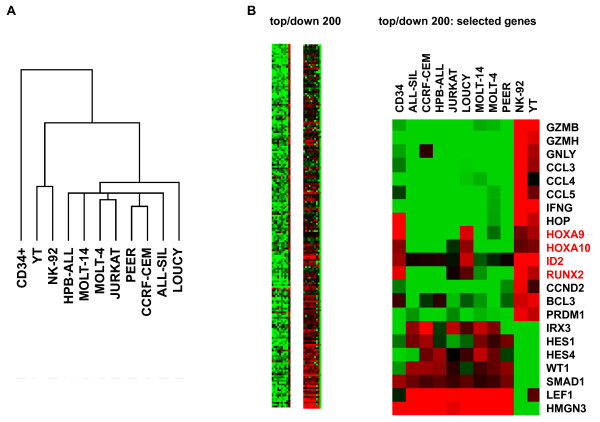
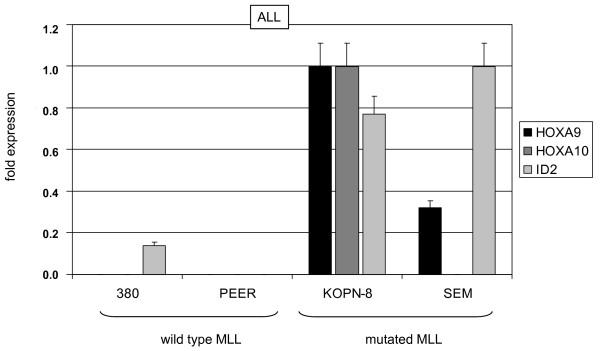
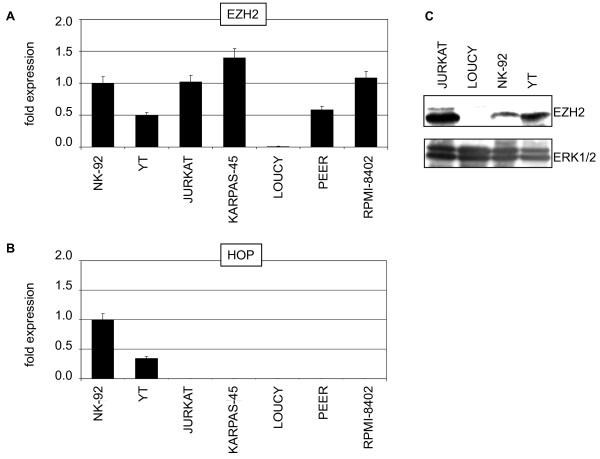
Results: This analysis showed high expression levels of HOXA9, HOXA10 and ID2 in NK-cell lines in addition to T-cell line LOUCY, suggesting leukemic deregulation therein. Overexpression experiments, chromatin immuno-precipitation and promoter analysis demonstrated that HOXA9 and HOXA10 directly activated expression of ID2. Concomitantly elevated expression levels of HOXA9 and HOXA10 together with ID2 in cell lines containing MLL translocations confirmed this form of regulation in both ALL and acute myeloid leukemia. Overexpression of HOXA9, HOXA10 or ID2 resulted in repressed expression of apoptosis factor BIM. Furthermore, profiling data of genes coding for chromatin regulators of homeobox genes, including components of polycomb repressor complex 2 (PRC2), indicated lacking expression of EZH2 in LOUCY and exclusive expression of HOP in NK-cell lines. Subsequent treatment of T-cell lines JURKAT and LOUCY with DZNep, an inhibitor of EZH2/PRC2, resulted in elevated and unchanged HOXA9/10 expression levels, respectively. Moreover, siRNA-mediated knockdown of EZH2 in JURKAT enhanced HOXA10 expression, confirming HOXA10-repression by EZH2. Additionally, profiling data and overexpression analysis indicated that reduced expression of E2F cofactor TFDP1 contributed to the lack of EZH2 in LOUCY. Forced expression of HOP in JURKAT cells resulted in reduced HOXA10 and ID2 expression levels, suggesting enhancement of PRC2 repression.
Conclusions: Our results show that major differentiation factors of the NK-cell lineage, including HOXA9, HOXA10 and ID2, were (de)regulated via PRC2 which therefore contributes to T-cell leukemogenesis.
Figures


Similar articles
-
Transcriptional deregulation of oncogenic myocyte enhancer factor 2C in T-cell acute lymphoblastic leukemia.Leuk Lymphoma. 2011 Feb;52(2):290-7. doi: 10.3109/10428194.2010.537003. Epub 2011 Jan 24. Leuk Lymphoma. 2011. PMID: 21261500
-
HOXA9 activates transcription of the gene encoding gp91Phox during myeloid differentiation.J Biol Chem. 2005 Apr 1;280(13):12359-70. doi: 10.1074/jbc.M408138200. Epub 2005 Jan 28. J Biol Chem. 2005. PMID: 15681849
-
The histone methyltransferase inhibitor, DZNep, up-regulates TXNIP, increases ROS production, and targets leukemia cells in AML.Blood. 2011 Sep 8;118(10):2830-9. doi: 10.1182/blood-2010-07-294827. Epub 2011 Jul 6. Blood. 2011. PMID: 21734239
-
The role of inhibitor of binding or differentiation 2 in the development and differentiation of immune cells.Immunobiology. 2019 Jan;224(1):142-146. doi: 10.1016/j.imbio.2018.09.006. Epub 2018 Sep 20. Immunobiology. 2019. PMID: 30340915 Review.
-
HOXA9 Regulome and Pharmacological Interventions in Leukemia.Adv Exp Med Biol. 2024;1459:405-430. doi: 10.1007/978-3-031-62731-6_18. Adv Exp Med Biol. 2024. PMID: 39017854 Review.
Cited by
-
The cohesin subunit Rad21 is a negative regulator of hematopoietic self-renewal through epigenetic repression of Hoxa7 and Hoxa9.Leukemia. 2017 Mar;31(3):712-719. doi: 10.1038/leu.2016.240. Epub 2016 Aug 24. Leukemia. 2017. PMID: 27554164 Free PMC article.
-
The Cxxc1 subunit of the Trithorax complex directs epigenetic licensing of CD4+ T cell differentiation.J Exp Med. 2021 Apr 5;218(4):e20201690. doi: 10.1084/jem.20201690. J Exp Med. 2021. PMID: 33433611 Free PMC article.
-
Aggressive NK Cell Leukemia: Current State of the Art.Cancers (Basel). 2020 Oct 9;12(10):2900. doi: 10.3390/cancers12102900. Cancers (Basel). 2020. PMID: 33050313 Free PMC article. Review.
-
Epigenetic mechanisms of tumor resistance to immunotherapy.Cell Mol Life Sci. 2018 Nov;75(22):4163-4176. doi: 10.1007/s00018-018-2908-7. Epub 2018 Aug 23. Cell Mol Life Sci. 2018. PMID: 30140960 Free PMC article. Review.
-
Genomic loss of EZH2 leads to epigenetic modifications and overexpression of the HOX gene clusters in myelodysplastic syndrome.Oncotarget. 2016 Feb 16;7(7):8119-30. doi: 10.18632/oncotarget.6992. Oncotarget. 2016. PMID: 26812882 Free PMC article.
References
Publication types
MeSH terms
Substances
Grants and funding
LinkOut - more resources
Full Text Sources
Research Materials
