Comparative Study
. 2010 Jun 17:11:383.
doi: 10.1186/1471-2164-11-383.

Comparison and calibration of transcriptome data from RNA-Seq and tiling arrays

Affiliations
Comparative Study

Comparison and calibration of transcriptome data from RNA-Seq and tiling arrays

Ashish Agarwal et al. BMC Genomics. .

Abstract

Background: Tiling arrays have been the tool of choice for probing an organism's transcriptome without prior assumptions about the transcribed regions, but RNA-Seq is becoming a viable alternative as the costs of sequencing continue to decrease. Understanding the relative merits of these technologies will help researchers select the appropriate technology for their needs.

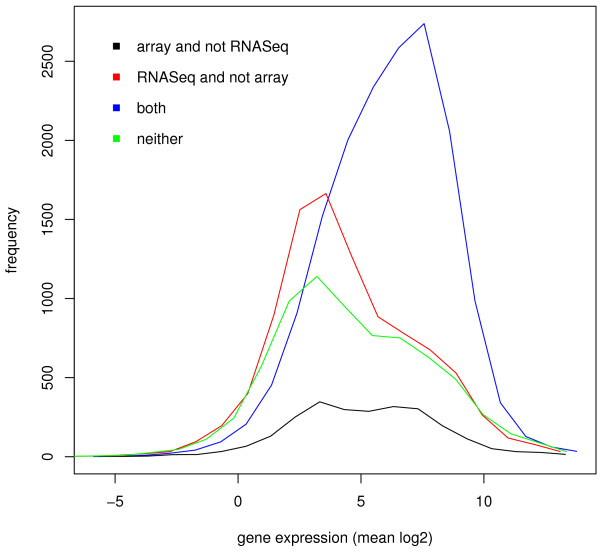
Results: Here, we compare these two platforms using a matched sample of poly(A)-enriched RNA isolated from the second larval stage of C. elegans. We find that the raw signals from these two technologies are reasonably well correlated but that RNA-Seq outperforms tiling arrays in several respects, notably in exon boundary detection and dynamic range of expression. By exploring the accuracy of sequencing as a function of depth of coverage, we found that about 4 million reads are required to match the sensitivity of two tiling array replicates. The effects of cross-hybridization were analyzed using a "nearest neighbor" classifier applied to array probes; we describe a method for determining potential "black list" regions whose signals are unreliable. Finally, we propose a strategy for using RNA-Seq data as a gold standard set to calibrate tiling array data. All tiling array and RNA-Seq data sets have been submitted to the modENCODE Data Coordinating Center.

Conclusions: Tiling arrays effectively detect transcript expression levels at a low cost for many species while RNA-Seq provides greater accuracy in several regards. Researchers will need to carefully select the technology appropriate to the biological investigations they are undertaking. It will also be important to reconsider a comparison such as ours as sequencing technologies continue to evolve.


Figures

Figure 1
Figure 1
Correlation of RNA expression levels between RNA-Seq and tiling array platforms. Each point represents a gene from the composite model. RNA-Seq expression levels per gene were measured using RPKM, and tiling array levels were measured using the mean intensity of probes falling within composite exons. The Spearman's coefficient is 0.90, indicating that the platforms correlate well on identical samples. The disproportionate number of genes in the upper left likely represents cross-hybridization.
Figure 2
Figure 2
Differential expression of genes between the L2 and YA stages. (a) Correlation of log2(YA/L2) ratios between RNA-Seq and tiling arrays. Differential expression was determined using the nonparametric Wilcoxon rank sum test. Black: not significantly differentially expressed between samples. Blue: significantly differentially expressed (q ≤ 0.01). The ratio of expression levels is well-correlated, but RNA-Seq has a larger dynamic range. (b) Venn diagram of genes called differentially expressed by each platform. There is significant overlap (8,976) between the two platforms, but more genes were called differentially expressed by RNA-Seq (14,201) than by tiling arrays (10,283), likely reflecting its greater dynamic range. A total of 4,326 genes were not called differentially expressed by either technology.
Figure 3
Figure 3
Histograms of gene expression levels. Four disjoint sets of genes are considered, those differentially expressed: by arrays but not RNA-Seq (black), by RNA-Seq but not arrays (red), by both platforms (blue), and by neither platform (green). Genes detected by just one platform (black, red) have lower expression than those detected by both (blue).
Figure 4
Figure 4
Exon boundary detection for tiling array and RNA-Seq. For every TAR, we computed its offset from its overlapping exon (excluding those that did not overlap with exactly one exon). (a) RNA-Seq has a median offset of 0 bp and a median absolute deviation of 2 bp, whereas (b) the tiling array has a median offset of 7 bp and a median absolute deviation of 25 bp. (c) Pictorial representation of how offsets were calculated. A negative offset means the TAR (orange) falls short of the exon (green) boundary and a positive offset means the TAR extends beyond the exon.
Figure 5
Figure 5
ROC curve analysis. Black: tiling array. Red: RNA-Seq with all 32 million reads. It is evident that the RNA-Seq substantially outperforms the tiling array with consistently higher sensitivity at lower FPR. Remaining curves are for RNA-Seq with only a subset of reads utilized. At an FPR = 0.05, just 4 million reads (blue) are required to attain the same sensitivity as two tiling array replicates.
Figure 6
Figure 6
Correlations between actual TAR intensities and that predicted by nearest neighbor probes. TARs determined by tiling array data were tiled with virtual probes and assigned intensities using their nearest neighbors (see main text). Red points have an overall similarity score in the top fifth percentile (black list TARs; Additional file 2). Green points correspond to TARs having an overall similarity score in the bottom fifth percentile. Gray points are the rest. (a) Correlation between TAR intensities determined by the tiling array and the TAR intensities determined by using nearest neighbor probes. The intensities of TARs with high similarity to their nearest neighbor probes (red) are well correlated with the actual intensities (Spearman's correlation = 0.873). (b) Correlation between TAR intensities determined by RNA-Seq and the nearest neighbor "pseudoprobes." The correlation of highly similar TARs (red) is much lower (Spearman's correlation = 0.500).
Figure 7
Figure 7
Comparison of nearest neighbor analysis for tiling arrays and RNA-Seq. (a) Correlation of TARs using intensities determined by RNA-Seq and tiling array. The colors scheme is identical to that in Figure 6a. As expected due to cross-hybridization, TARs with high similarity scores are called expressed by tiling arrays but not by RNA-Seq. (b) Density plot showing fraction of TARs (y-axis) with a given RNA-Seq expression level (x-axis). As above, TARs are segregated by similarity. It is clear that TARs with the highest similarity (red) fall in a different distribution and are generally not expressed according to the RNA-Seq data. (c) Similar but x-axis is the TAR intensity from tiling arrays. In this case, highly similar TARs are more likely to be highly expressed, suggestive of cross-hybridization. The distribution of highly similar TARs exhibits a bump, possibly due to more highly expressed TARs being more likely to exhibit cross-hybridization.
Figure 8
Figure 8
Schematic describing the tiling array analysis and FPR calibration pipeline. First, we optimize the threshold, maxgap, and minrun parameters of tiling arrays and RNA-Seq segmentation, notated T, G, and R, respectively. To do this, we compare the called TARs to a manually curated gold standard set and do a brute-force search over the parameter space to attain an FPR of 0.05 with maximum sensitivity. Then, as detailed in the main text, we calculate a rank score for each tiling array TAR by comparing its intensity to a distribution of null TARs constructed from non-exonic regions. We then map this value to a marginal FPR, which is calculated by sorting the TARs based on their rank score and then iteratively selecting smaller subsets of TARs, assigning the FPR to the TAR defining the outermost boundary. This marginal FPR can then be adjusted by following a similar procedure using the RNA-Seq data as a gold standard set, giving a calibrated marginal FPR for each TAR.

Similar articles

Cited by

References

    1. Kapranov P, Cawley SE, Drenkow J, Bekiranov S, Strausberg RL, Fodor SPA, Gingeras TR. Large-scale transcriptional activity in chromosomes 21 and 22. Science (New York, N.Y.) 2002;296(5569):916–919. - PubMed
    1. Rinn JL, Euskirchen G, Bertone P, Martone R, Luscombe NM, Hartman S, Harrison PM, Nelson FK, Miller P, Gerstein M, Weissman S, Snyder M. The transcriptional activity of human Chromosome 22. Genes & Development. 2003;17(4):529–540. doi: 10.1101/gad.1055203. - DOI - PMC - PubMed
    1. Bertone P, Stolc V, Royce TE, Rozowsky JS, Urban AE, Zhu X, Rinn JL, Tongprasit W, Samanta M, Weissman S, Gerstein M, Snyder M. Global identification of human transcribed sequences with genome tiling arrays. Science. 2004;306(5705):2242–6. doi: 10.1126/science.1103388. - DOI - PubMed
    1. Manak JR, Dike S, Sementchenko V, Kapranov P, Biemar F, Long J, Cheng J, Bell I, Ghosh S, Piccolboni A, Gingeras TR. Biological function of unannotated transcription during the early development of Drosophila melanogaster. Nature Genetics. 2006;38(10):1151–8. doi: 10.1038/ng1875. - DOI - PubMed
    1. David L, Huber W, Granovskaia M, Toedling J, Palm CJ, Bofkin L, Jones T, Davis RW, Steinmetz LM. A high-resolution map of transcription in the yeast genome. Proceedings of the National Academy of Sciences PNAS. 2006;103(14):5320–5325. doi: 10.1073/pnas.0601091103. - DOI - PMC - PubMed

Publication types

LinkOut - more resources