

Calcium-sensing receptors regulate cardiomyocyte Ca2+ signaling via the sarcoplasmic reticulum-mitochondrion interface during hypoxia/reoxygenation
- PMID: 20565791
- PMCID: PMC2908572
- DOI: 10.1186/1423-0127-17-50
Calcium-sensing receptors regulate cardiomyocyte Ca2+ signaling via the sarcoplasmic reticulum-mitochondrion interface during hypoxia/reoxygenation
Abstract
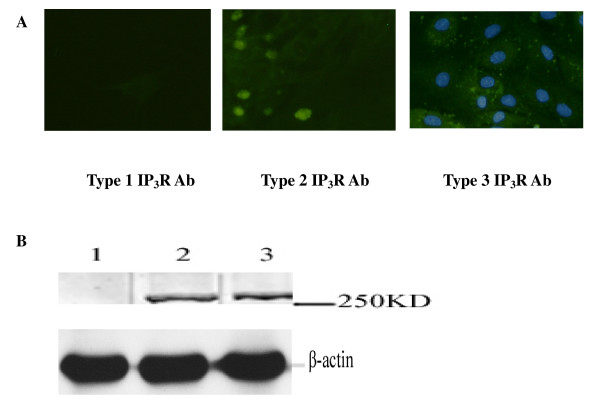
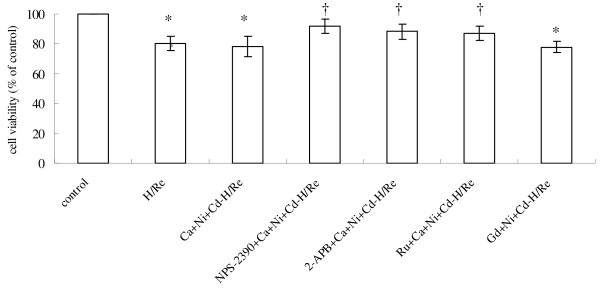
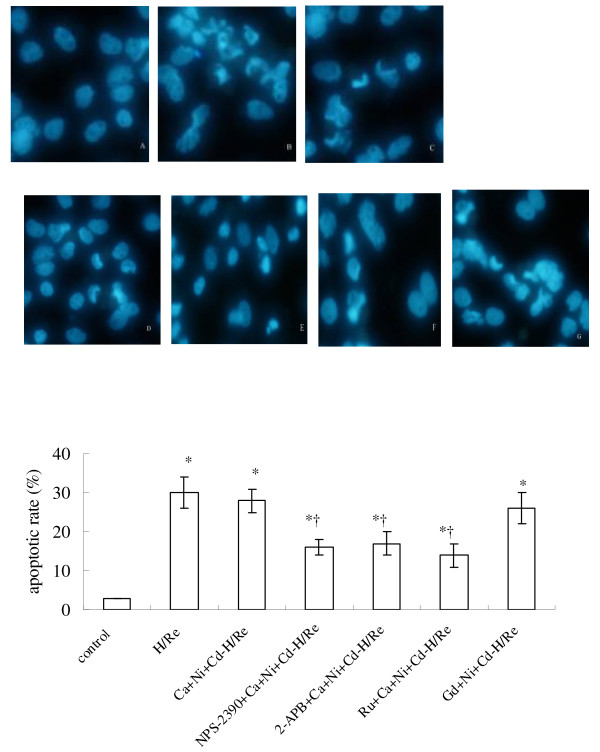
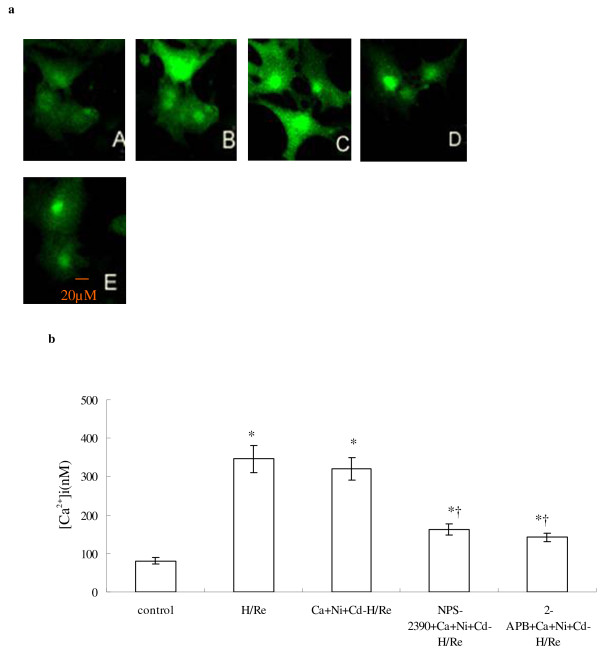
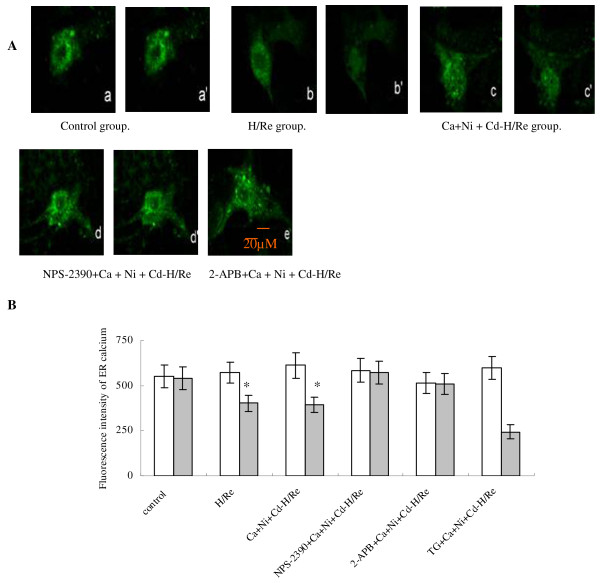
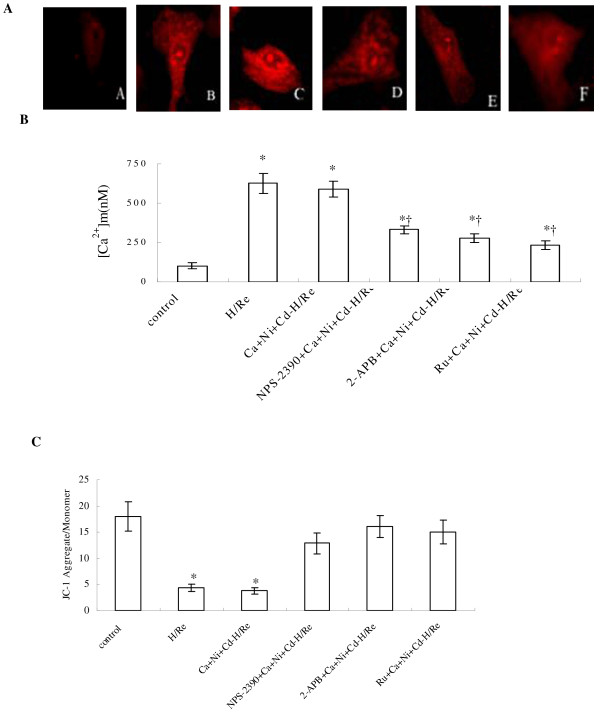
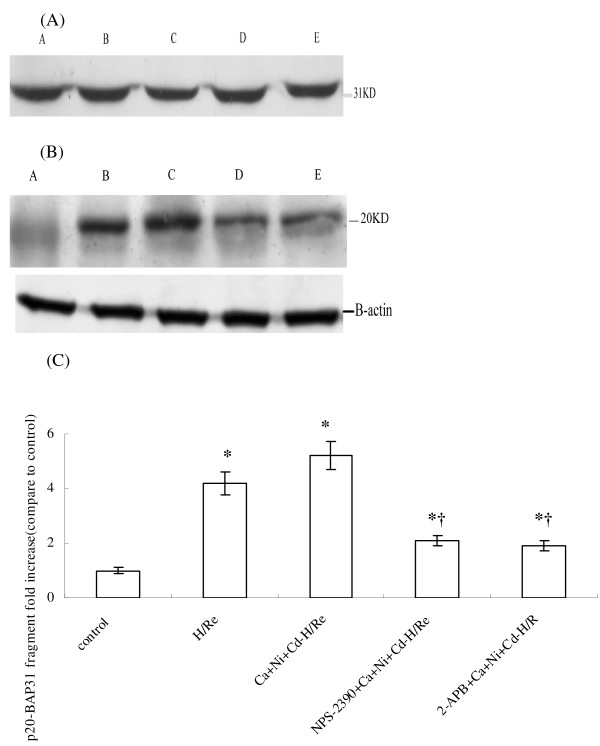
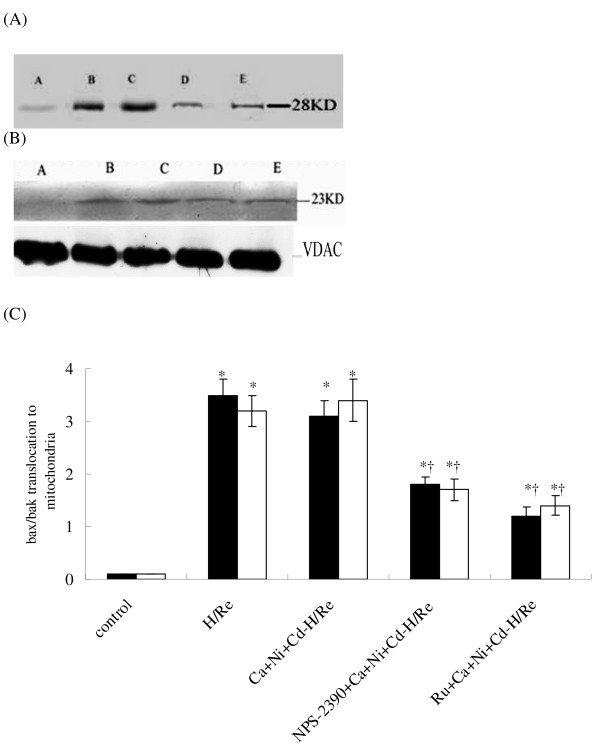
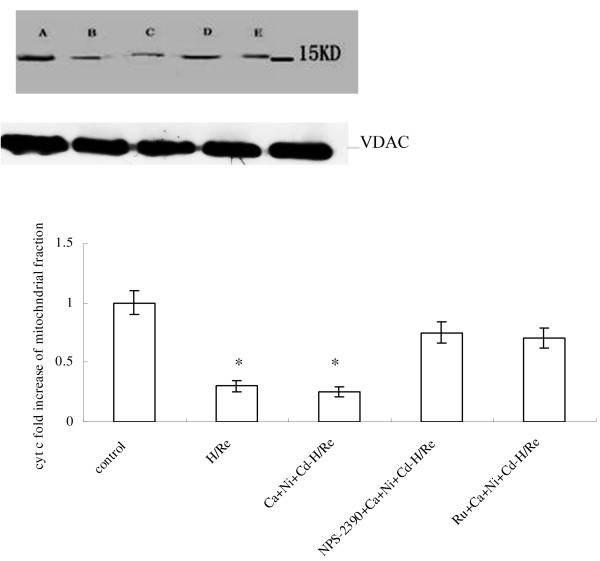
Communication between the SR (sarcoplasmic reticulum, SR) and mitochondria is important for cell survival and apoptosis. The SR supplies Ca2+ directly to mitochondria via inositol 1,4,5-trisphosphate receptors (IP3Rs) at close contacts between the two organelles referred to as mitochondrion-associated ER membrane (MAM). Although it has been demonstrated that CaR (calcium sensing receptor) activation is involved in intracellular calcium overload during hypoxia/reoxygenation (H/Re), the role of CaR activation in the cardiomyocyte apoptotic pathway remains unclear. We postulated that CaR activation plays a role in the regulation of SR-mitochondrial inter-organelle Ca2+ signaling, causing apoptosis during H/Re. To investigate the above hypothesis, cultured cardiomyocytes were subjected to H/Re. We examined the distribution of IP3Rs in cardiomyocytes via immunofluorescence and Western blotting and found that type 3 IP3Rs were located in the SR. [Ca2+]i, [Ca2+]m and [Ca2+]SR were determined using Fluo-4, x-rhod-1 and Fluo 5N, respectively, and the mitochondrial membrane potential was detected with JC-1 during reoxygenation using laser confocal microscopy. We found that activation of CaR reduced [Ca2+]SR, increased [Ca2+]i and [Ca2+]m and decreased the mitochondrial membrane potential during reoxygenation. We found that the activation of CaR caused the cleavage of BAP31, thus generating the pro-apoptotic p20 fragment, which induced the release of cytochrome c from mitochondria and the translocation of bak/bax to mitochondria. Taken together, these results reveal that CaR activation causes Ca2+ release from the SR into the mitochondria through IP3Rs and induces cardiomyocyte apoptosis during hypoxia/reoxygenation.
Figures
Similar articles
-
Role of the calcium-sensing receptor in cardiomyocyte apoptosis via the sarcoplasmic reticulum and mitochondrial death pathway in cardiac hypertrophy and heart failure.Cell Physiol Biochem. 2013;31(4-5):728-43. doi: 10.1159/000350091. Epub 2013 May 23. Cell Physiol Biochem. 2013. PMID: 23711498
-
Calcium-sensing receptors induce apoptosis in rat cardiomyocytes via the endo(sarco)plasmic reticulum pathway during hypoxia/reoxygenation.Basic Clin Pharmacol Toxicol. 2010 May;106(5):396-405. doi: 10.1111/j.1742-7843.2009.00502.x. Epub 2009 Dec 22. Basic Clin Pharmacol Toxicol. 2010. PMID: 20030631
-
Post-conditioning protecting rat cardiomyocytes from apoptosis via attenuating calcium-sensing receptor-induced endo(sarco)plasmic reticulum stress.Mol Cell Biochem. 2012 Feb;361(1-2):123-34. doi: 10.1007/s11010-011-1096-7. Epub 2011 Oct 5. Mol Cell Biochem. 2012. PMID: 21984037
-
Sarco-Endoplasmic Reticulum Calcium Release Model Based on Changes in the Luminal Calcium Content.Adv Exp Med Biol. 2020;1131:337-370. doi: 10.1007/978-3-030-12457-1_14. Adv Exp Med Biol. 2020. PMID: 31646517 Review.
-
Bcl-2 family in inter-organelle modulation of calcium signaling; roles in bioenergetics and cell survival.J Bioenerg Biomembr. 2014 Feb;46(1):1-15. doi: 10.1007/s10863-013-9527-7. J Bioenerg Biomembr. 2014. PMID: 24078116 Free PMC article. Review.
Cited by
-
A neuroendocrine mechanism of co-morbidity of depression-like behavior and myocardial injury in rats.PLoS One. 2014 Feb 13;9(2):e88427. doi: 10.1371/journal.pone.0088427. eCollection 2014. PLoS One. 2014. PMID: 24551098 Free PMC article.
-
Mitochondria-associated endoplasmic reticulum membrane (MAM): a dark horse for diabetic cardiomyopathy treatment.Cell Death Discov. 2024 Mar 20;10(1):148. doi: 10.1038/s41420-024-01918-3. Cell Death Discov. 2024. PMID: 38509100 Free PMC article. Review.
-
The Different Facets of Extracellular Calcium Sensors: Old and New Concepts in Calcium-Sensing Receptor Signalling and Pharmacology.Int J Mol Sci. 2018 Mar 27;19(4):999. doi: 10.3390/ijms19040999. Int J Mol Sci. 2018. PMID: 29584660 Free PMC article. Review.
-
Calcium signaling from sarcoplasmic reticulum and mitochondria contact sites in acute myocardial infarction.J Transl Med. 2024 Jun 9;22(1):552. doi: 10.1186/s12967-024-05240-5. J Transl Med. 2024. PMID: 38853272 Free PMC article. Review.
-
Research Progress on the Ability of Astragaloside IV to Protect the Brain Against Ischemia-Reperfusion Injury.Front Neurosci. 2021 Nov 16;15:755902. doi: 10.3389/fnins.2021.755902. eCollection 2021. Front Neurosci. 2021. PMID: 34867166 Free PMC article. Review.
References
-
- Duchen MR. Mitochondria in health and disease: perspectives on a new mitochondrial biology. Mol Aspects Med. 2004;25:365–451. - PubMed
Publication types
MeSH terms
Substances
LinkOut - more resources
Full Text Sources
Research Materials
Miscellaneous
