. 2010 Jun 18:10:12.
doi: 10.1186/1471-2342-10-12.

Estimating view parameters from random projections for Tomography using spherical MDS

Affiliations

Estimating view parameters from random projections for Tomography using spherical MDS

Yi Fang et al. BMC Med Imaging. .

Abstract

Background: During the past decade, the computed tomography has been successfully applied to various fields especially in medicine. The estimation of view angles for projections is necessary in some special applications of tomography, for example, the structuring of viruses using electron microscopy and the compensation of the patient's motion over long scanning period.

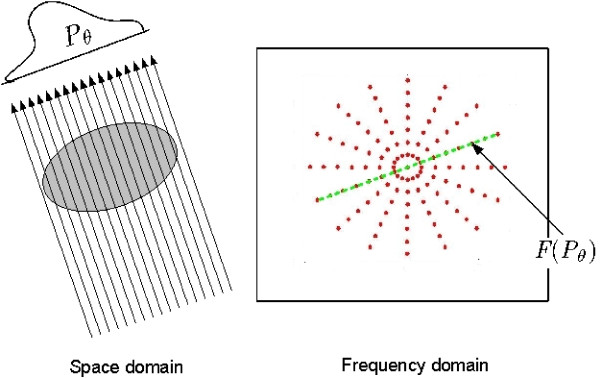
Methods: This work introduces a novel approach, based on the spherical multidimensional scaling (sMDS), which transforms the problem of the angle estimation to a sphere constrained embedding problem. The proposed approach views each projection as a high dimensional vector with dimensionality equal to the number of sampling points on the projection. By using SMDS, then each projection vector is embedded onto a 1D sphere which parameterizes the projection with respect to view angles in a globally consistent manner. The parameterized projections are used for the final reconstruction of the image through the inverse radon transform. The entire reconstruction process is non-iterative and computationally efficient.

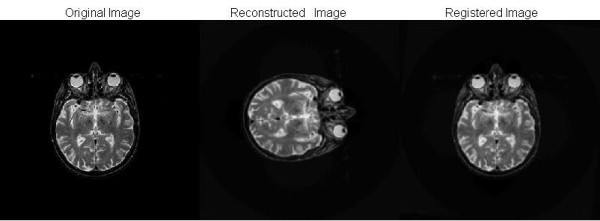
Results: The effectiveness of the sMDS is verified with various experiments, including the evaluation of the reconstruction quality from different number of projections and resistance to different noise levels. The experimental results demonstrate the efficiency of the proposed method.

Conclusion: Our study provides an effective technique for the solution of 2D tomography with unknown acquisition view angles. The proposed method will be extended to three dimensional reconstructions in our future work. All materials, including source code and demos, are available on https://engineering.purdue.edu/PRECISE/SMDS.


Figures

Figure 1
Figure 1
Reconstruction flowchart. The flowchart shows three basic steps of the reconstruction procedure from projections data with unknown view angles. Figure (A) is the original brain MR image. Figure (B) shows the projections data generated by projecting the brain image from a set of view angles randomly. All of projection data stack up along the vertical direction. We can see from the figure that the order of the projection data is really shuffled due to the random projection angels. Figure (C) shows the sorted projection data, which is also named sinogram. The comparison between Figure (B) and Figure(C) demonstrates the capability of our method for sorting the projection data. Figure (D) display the reconstructed image from the sorted projection data by using the inverse radon transform. The reconstructed image is subject to a global rotation transform of the original image.
Figure 2
Figure 2
Illustration of Fourier slice theorem. The Figure illustrates the basics of Fourier slice theorem. The left figure shows the simulation of generating the projection from the view angle θ. The Pθ denotes the projection from view angle θ. The right figure shows the Fourier transform of the image in the left. The green marked slice and the Fourier transform of Pθ are equal according to the Fourier slice theorem.
Figure 3
Figure 3
Brain MR image. Figure displays a normal brain MR image. The image is downloaded from the Whole Brain Atlas, Harvard University.
Figure 4
Figure 4
Random projections and its rearrangement. Two figures display the projections generated from a set of view angles. The horizontal axis denotes the index of projections and the vertical axis denotes the sample positions of each projection. As we can find, the range of horizontal axis from 0 to 360 indicates that there are total 360 projections in this figure, and the range of vertical axis from 0 to 300 indicates that there are 300 sampled points on each projection. The colorbar on the right side indicate the value of projection data. The projection data in the Figure (A) and Figure (B) are the same set, but the difference between two figures is that projections in (A) are unordered and sorted in (B). The figure (B) is a common named sinogram, produced by the radon transform of the image. Comparison between two figures demonstrates the performance of our method in rearranging the randomly produced projections.
Figure 5
Figure 5
Reconstruction results. The reconstructed images from the projections, which are generated by projecting Figure 3 through different view angles. N and T in the figure denote the number of projections and threshold for neighbor relation determination respectively. As we can see, the reconstruction quality is enhanced with the increase of the number of the projections. Note that the threshold would be adjusted with the change of number of projection as the more the projection the less the distance between pairwise projections.
Figure 6
Figure 6
Original image, reconstructed image and registered image. The reconstructed images from the projections, which are generated by projecting Figure 3 through different view angles. There are 512 projections generated uniformly and are randomly shuffled. The image on left is the original image, the middle one is the reconstructed from the random projections and the image on the right is the registered image.
Figure 7
Figure 7
The reconstruction results of the 2D cryoEM projections. The figure shows the reconstruction results from the 2D cryoEM projections. Figure (A-C) are the original cryoEM projections. Figure (D-F) are the corresponding reconstruction results of Figure (A-C) respectively.
Figure 8
Figure 8
Reconstruction from noisy projections. There are six figures displaying the reconstruction results from noisy projections. The projections in different figures are corrupted by the noise to different extent. The SNR underneath each figure indicates the signal noise ratio. We can conclude, from the observation and comparison of the six reconstructed images, that our method is tolerable to noisy data. The reconstruction quality seems reasonable even when the SNR is around 2 dB, in Figure (B).
Figure 9
Figure 9
The illustration of dimension reduction.

Similar articles

Cited by

References

    1. Hiriyannaiah H. X-ray computed tomography for medical imaging. Signal Processing Magazine, IEEE. 1997;14(2):42–59. doi: 10.1109/79.581370. - DOI
    1. Smith BD. Cone-beam tomography: recent advances and a tutorial review. Optical Engineering. 1990;29
    1. Basu S, Bresler Y. Feasibility of Tomography with Unknown View Angles. IEEE Transactions on Image Processing. 2000;9:1107–1122. doi: 10.1109/83.846252. - DOI - PubMed
    1. Lewitt RM, Matej S. Overview of Methods for Image Reconstruction From Projections in Emission Computed Tomography. Proceedings Of The IEEE. pp. 1588–1611. - DOI
    1. Yagle AE. A simple non-iterative algorithm for 2-D tomography with unknown view angles. Appeared as a preprint copy. http://www.eecs.umich.edu/~aey/recent/angle.pdf

Publication types

MeSH terms