Meta-Analysis
. 2010 Jun 18:10:46.
doi: 10.1186/1471-2377-10-46.

A systematic review of population based epidemiological studies in Myasthenia Gravis

Affiliations
Meta-Analysis

A systematic review of population based epidemiological studies in Myasthenia Gravis

Aisling S Carr et al. BMC Neurol. .

Abstract

Background: The aim was to collate all myasthenia gravis (MG) epidemiological studies including AChR MG and MuSK MG specific studies. To synthesize data on incidence rate (IR), prevalence rate (PR) and mortality rate (MR) of the condition and investigate the influence of environmental and technical factors on any trends or variation observed.

Methods: Studies were identified using multiple sources and meta-analysis performed to calculate pooled estimates for IR, PR and MR.

Results: 55 studies performed between 1950 and 2007 were included, representing 1.7 billion population-years. For All MG estimated pooled IR (eIR): 5.3 per million person-years (C.I.:4.4, 6.1), range: 1.7 to 21.3; estimated pooled PR: 77.7 per million persons (C.I.:64.0, 94.3), range 15 to 179; MR range 0.1 to 0.9 per millions person-years. AChR MG eIR: 7.3 (C.I.:5.5, 7.8), range: 4.3 to 18.0; MuSK MG IR range: 0.1 to 0.32. However marked variation persisted between populations studied with similar methodology and in similar areas.

Conclusions: We report marked variation in observed frequencies of MG. We show evidence of increasing frequency of MG with year of study and improved study quality. This probably reflects improved case ascertainment. But other factors must also influence disease onset resulting in the observed variation in IR across geographically and genetically similar populations.


Figures

Figure 1
Figure 1
Geographical distribution of epidemiological studies in myasthenia gravis. Studies of all patients with autoimmune myasthenia gravis: RED. AChR MG specific studies: YELLOW. MuSK MG specific studies: PINK. Broad geographical distribution of included studies is shown with a preponderance of European studies.
Figure 2
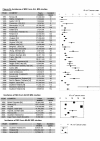
Figure 2
Incidence rates of myasthenia gravis. Incidence rate (IR) is shown in cases per million person years with 95% confidence intervals according to the Poisson distribution and weighting according to the random effects model. The variation between rates, or heterogeneity, leaves the estimated pooled IR difficult to interpret so it is better to summarise this data using ranges. All MG: estimated pooled IR (eIR) = 5.3 cases per million person years (C.I.: 4.41 - 6.1), range = 1.7 to 21.3; AChR MG: eIR = 7.3 (C.I.: 5.5, 7.8), range = 4.3 to 18.0; MuSK MG: range = 0.1-0.32.
Figure 3
Figure 3
Incidence rate and prevalence rates with time. IR in cases per million person years and PR in cases per million persons are plotted against final year of study. The area each circle is proportional to the size of the study population.
Figure 4
Figure 4
Age and sex specific incidence rates. Age and sex specific IR is shown in cases per million person years. An increasing frequency of disease with age is seen in all populations. However, only 5 out of 14 shown a bimodal distribution in IR with the peak in younger women not observed in the remaining 9 studies.
Figure 5
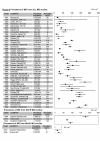
Figure 5
Prevalence rates of myasthenia gravis. Prevalence rate (PR) is shown in cases per million persons with 95% confidence intervals (95% C.I.) according to the Poisson distribution and weighting according to the random effects model. All MG ePR = 77.67 cases per million (C.I.: 63.98, 94.30), range = 15 to 179 cases per million; AChR MG: range = 70.6 to 163.5; MuSK range = 1.9-2.9.

Similar articles

Cited by

References

    1. Meriggioli MN, Sanders DB. Autoimmune myasthenia gravis: emerging clinical and biological heterogeneity. Lancet Neurol. 2009;8(5):475–90. doi: 10.1016/S1474-4422(09)70063-8. - DOI - PMC - PubMed
    1. Lindstrom JM, Seybold ME, Lennon VA. Antibody to acetylcholine receptor in myasthenia gravis. Prevalence, clinical correlates, and diagnostic value. Neurology. 1976;26(11):1054–9. - PubMed
    1. Hoch WJ, McConville J, Helms S. Autoantibodies to the receptor tyrosine kinase MuSK in patients with myasthenia gravis without acetylcholine receptor antibodies. Nat Med. 2001;7(3):365–368. doi: 10.1038/85520. - DOI - PubMed
    1. Kurtzke JF. Epidemiology of myasthenia gravis. Advances in Neurology. 1978;19:545–566. - PubMed
    1. Phillips LH, Torner JC. Epidemiologic evidence for changing natural history of myasthenia gravis. Neurology. 1996;47:1233–1238. - PubMed