

Identifying interactions in the time and frequency domains in local and global networks - A Granger Causality Approach
- PMID: 20565962
- PMCID: PMC2897832
- DOI: 10.1186/1471-2105-11-337
Identifying interactions in the time and frequency domains in local and global networks - A Granger Causality Approach
Abstract
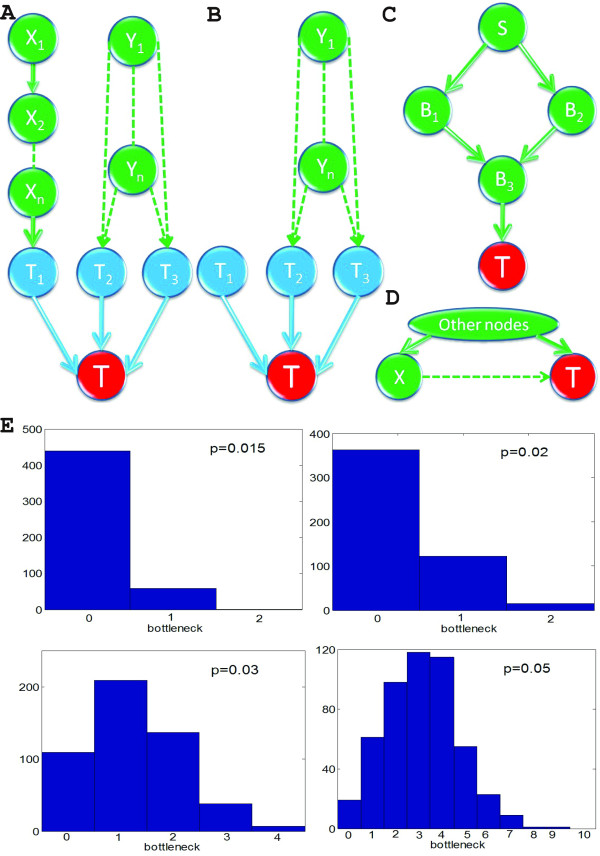
Background: Reverse-engineering approaches such as Bayesian network inference, ordinary differential equations (ODEs) and information theory are widely applied to deriving causal relationships among different elements such as genes, proteins, metabolites, neurons, brain areas and so on, based upon multi-dimensional spatial and temporal data. There are several well-established reverse-engineering approaches to explore causal relationships in a dynamic network, such as ordinary differential equations (ODE), Bayesian networks, information theory and Granger Causality.
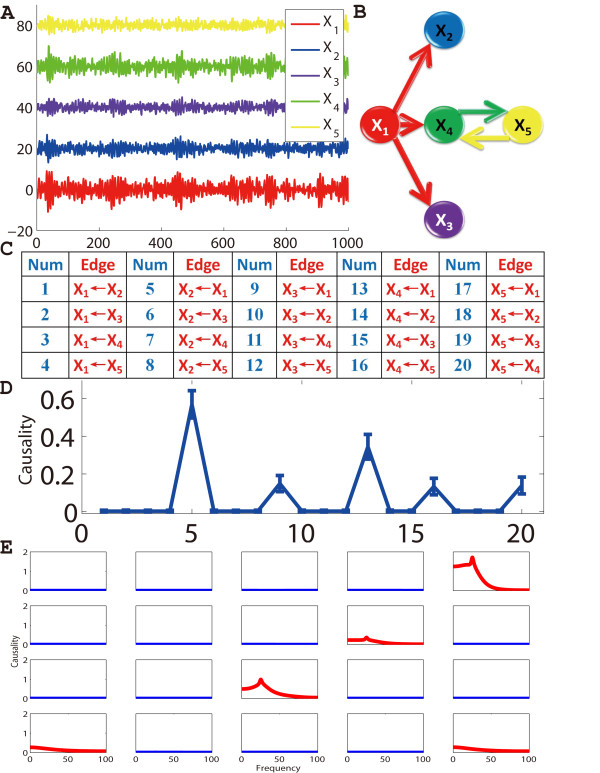
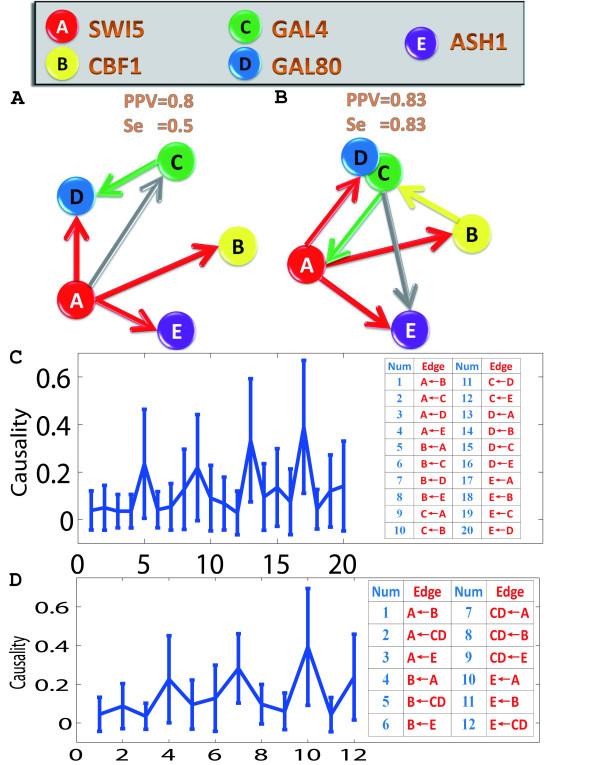
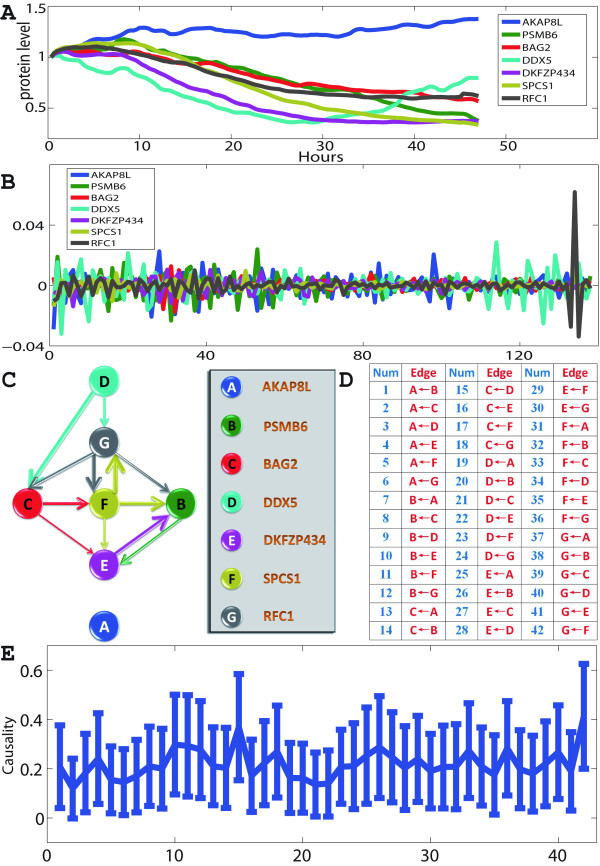
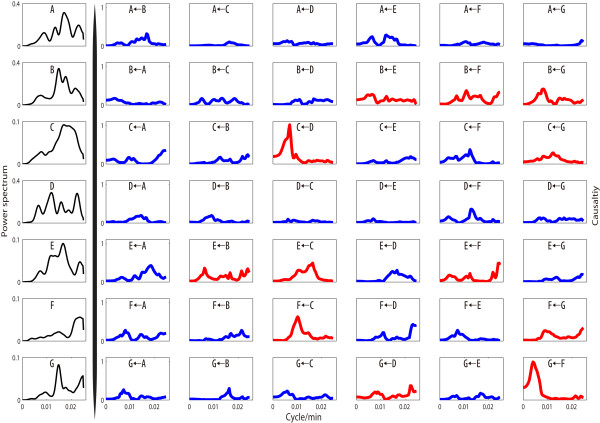
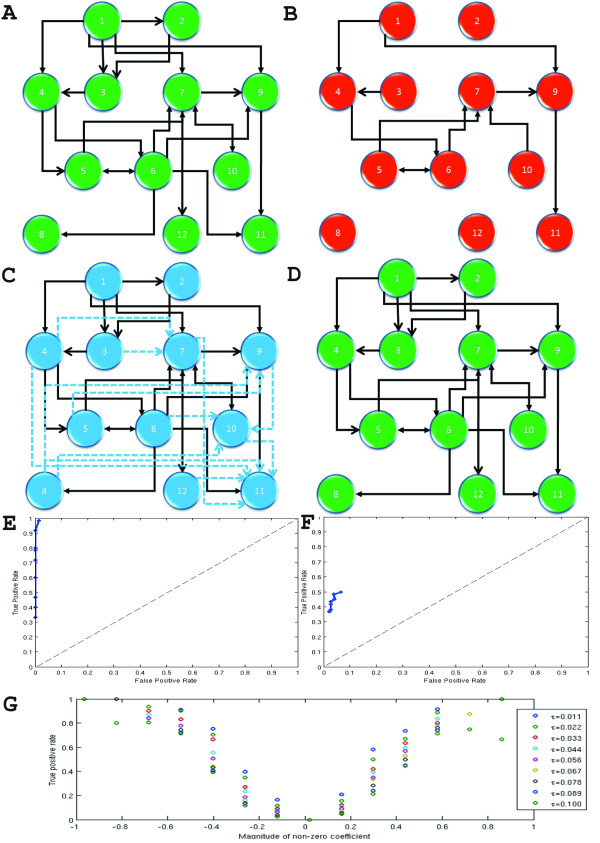
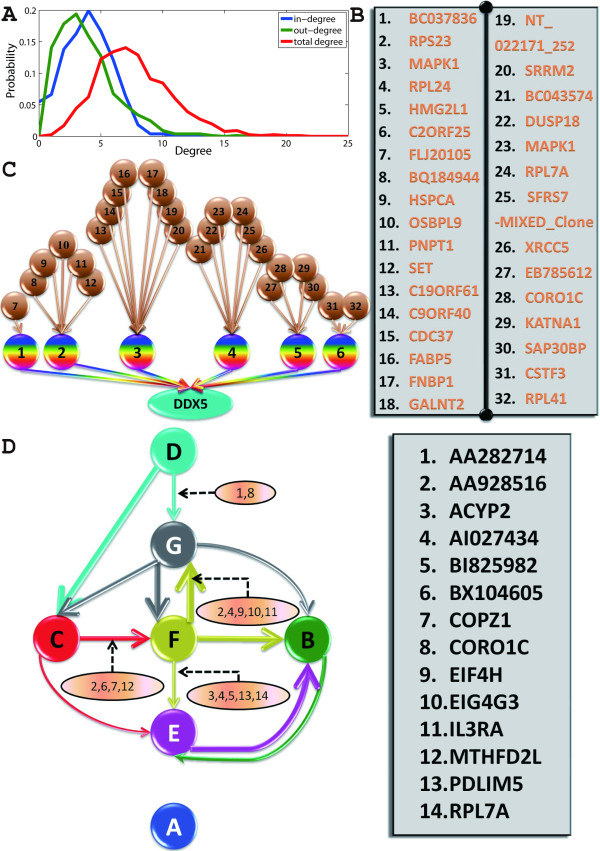
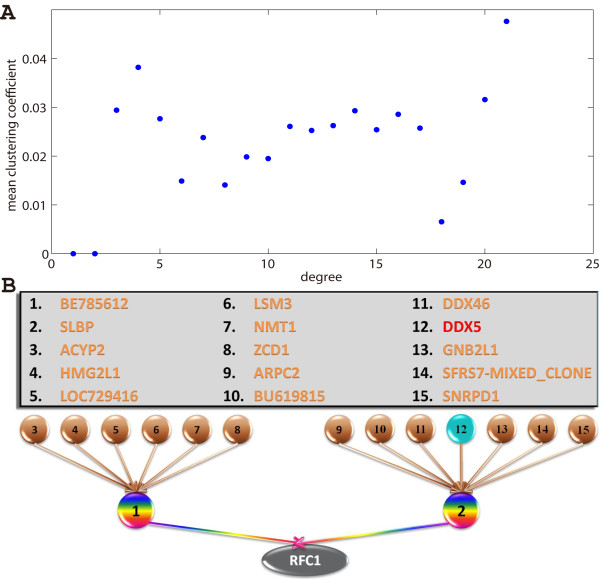
Results: Here we focused on Granger causality both in the time and frequency domain and in local and global networks, and applied our approach to experimental data (genes and proteins). For a small gene network, Granger causality outperformed all the other three approaches mentioned above. A global protein network of 812 proteins was reconstructed, using a novel approach. The obtained results fitted well with known experimental findings and predicted many experimentally testable results. In addition to interactions in the time domain, interactions in the frequency domain were also recovered.
Conclusions: The results on the proteomic data and gene data confirm that Granger causality is a simple and accurate approach to recover the network structure. Our approach is general and can be easily applied to other types of temporal data.
Figures
Similar articles
-
Granger causality vs. dynamic Bayesian network inference: a comparative study.BMC Bioinformatics. 2009 Apr 24;10:122. doi: 10.1186/1471-2105-10-122. BMC Bioinformatics. 2009. PMID: 19393071 Free PMC article.
-
Windowed Granger causal inference strategy improves discovery of gene regulatory networks.Proc Natl Acad Sci U S A. 2018 Feb 27;115(9):2252-2257. doi: 10.1073/pnas.1710936115. Epub 2018 Feb 12. Proc Natl Acad Sci U S A. 2018. PMID: 29440433 Free PMC article.
-
Gene network inference using continuous time Bayesian networks: a comparative study and application to Th17 cell differentiation.BMC Bioinformatics. 2014 Dec 11;15(1):387. doi: 10.1186/s12859-014-0387-x. BMC Bioinformatics. 2014. PMID: 25495206 Free PMC article.
-
Investigating effective brain connectivity from fMRI data: past findings and current issues with reference to Granger causality analysis.Brain Connect. 2012;2(5):235-45. doi: 10.1089/brain.2012.0091. Brain Connect. 2012. PMID: 23016794 Free PMC article. Review.
-
Autoregressive models for gene regulatory network inference: sparsity, stability and causality issues.Math Biosci. 2013 Dec;246(2):326-34. doi: 10.1016/j.mbs.2013.10.003. Epub 2013 Oct 28. Math Biosci. 2013. PMID: 24176667 Review.
Cited by
-
An algebra-based method for inferring gene regulatory networks.BMC Syst Biol. 2014 Mar 26;8:37. doi: 10.1186/1752-0509-8-37. BMC Syst Biol. 2014. PMID: 24669835 Free PMC article.
-
Granger causality-based synaptic weights estimation for analyzing neuronal networks.J Comput Neurosci. 2015 Jun;38(3):483-97. doi: 10.1007/s10827-015-0550-z. Epub 2015 Mar 13. J Comput Neurosci. 2015. PMID: 25761744
-
A Digital Repository and Execution Platform for Interactive Scholarly Publications in Neuroscience.Neuroinformatics. 2016 Jan;14(1):23-40. doi: 10.1007/s12021-015-9276-3. Neuroinformatics. 2016. PMID: 26306864
-
Near-field electromagnetic holography for high-resolution analysis of network interactions in neuronal tissue.J Neurosci Methods. 2015 Sep 30;253:1-9. doi: 10.1016/j.jneumeth.2015.05.016. Epub 2015 May 28. J Neurosci Methods. 2015. PMID: 26026581 Free PMC article.
-
Description length guided nonlinear unified Granger causality analysis.Netw Neurosci. 2023 Oct 1;7(3):1109-1128. doi: 10.1162/netn_a_00316. eCollection 2023. Netw Neurosci. 2023. PMID: 37781142 Free PMC article.
References
-
- Alon U. An introduction to Systems Biology: Design Principles of Biological Circuits. Chapman and Hall/CRC; 2007.
-
- Klipp E, Herwig R, Kowald A, Wierling C, Lehrach H. Systems biology in practice: Concepts, Implementation and Application. WILEY-VCH Verlag GmbH CO. KGaA; 2005.
-
- Wiener N. In: Modern Mathematics for Engineers. Beckenbach EF, editor. Vol. 1. New York: McGraw-Hill; 1956. The theory of prediction.
-
- Granger C. Investigating causal relations by econometric models and cross-spectral methods. Econometrica. 1969;37:424–438. doi: 10.2307/1912791. - DOI
-
- Granger C. Testing for Causality: A Personal Viewpoint. Journal of Economic Dynamics and Control. 1980;2:329–352. doi: 10.1016/0165-1889(80)90069-X. - DOI
Publication types
MeSH terms
Substances
LinkOut - more resources
Full Text Sources
