

Heart transcriptome of the bank vole (Myodes glareolus): towards understanding the evolutionary variation in metabolic rate
- PMID: 20565972
- PMCID: PMC2996923
- DOI: 10.1186/1471-2164-11-390
Heart transcriptome of the bank vole (Myodes glareolus): towards understanding the evolutionary variation in metabolic rate
Abstract
Background: Understanding the genetic basis of adaptive changes has been a major goal of evolutionary biology. In complex organisms without sequenced genomes, de novo transcriptome assembly using a longer read sequencing technology followed by expression profiling using short reads is likely to provide comprehensive identification of adaptive variation at the expression level and sequence polymorphisms in coding regions. We performed sequencing and de novo assembly of the bank vole heart transcriptome in lines selected for high metabolism and unselected controls.
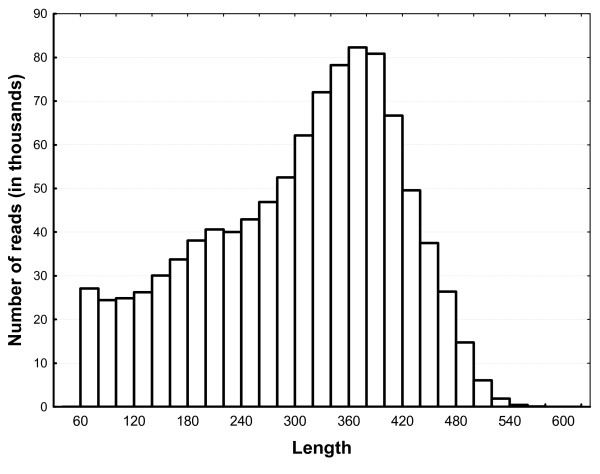
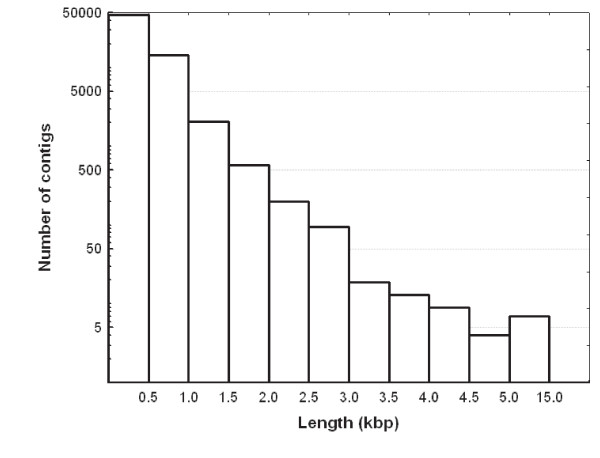
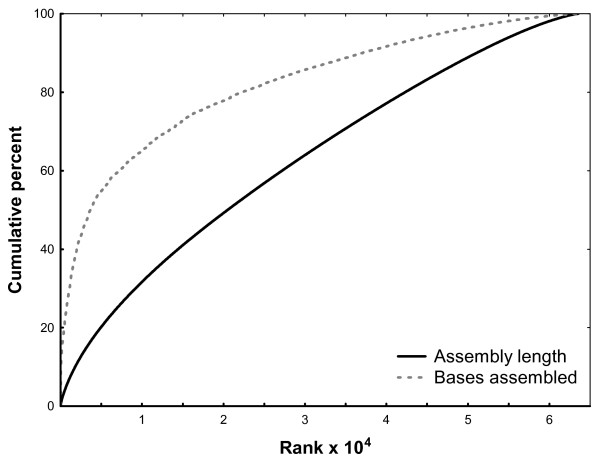
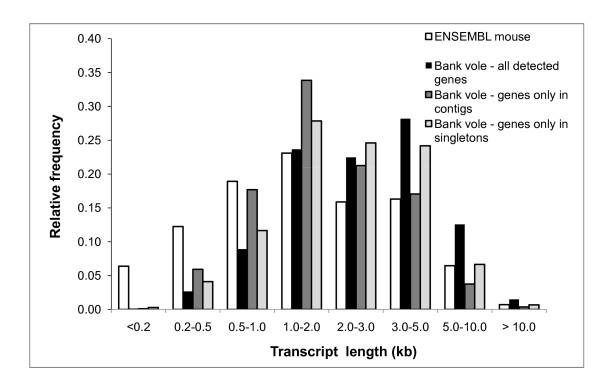
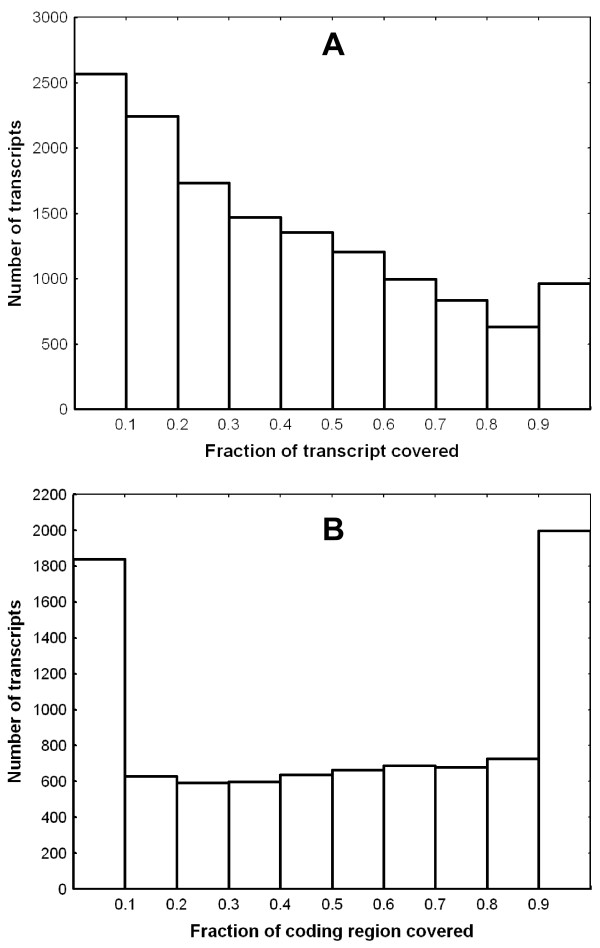
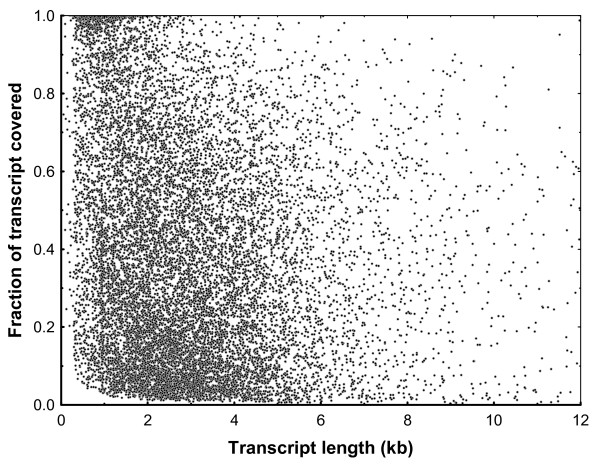
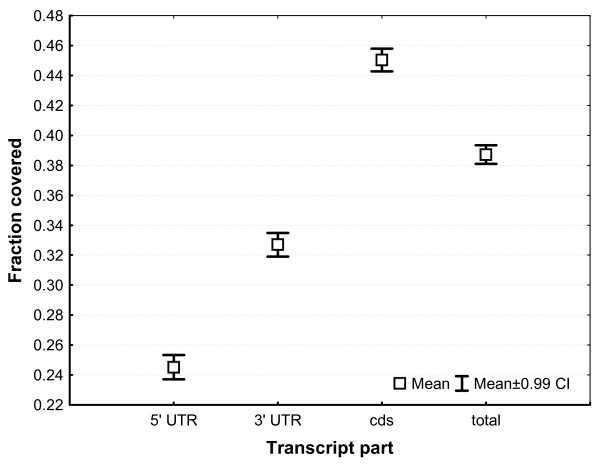
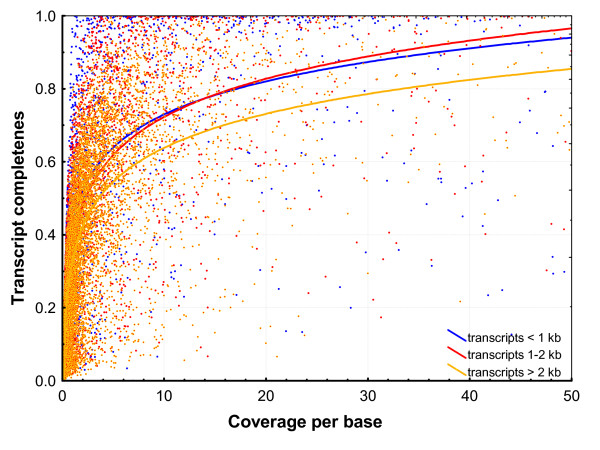
Results: A single 454 Titanium run produced over million reads, which were assembled into 63,581 contigs. Searches against the SwissProt protein database and the ENSEMBL collection of mouse transcripts detected similarity to 11,181 and 14,051 genes, respectively. As judged by the representation of genes from the heart-related Gene Ontology categories and UniGenes detected in the mouse heart, our detection of the genes expressed in the heart was nearly complete (> 95% and almost 90% respectively). On average, 38.7% of the transcript length was covered by our sequences, with notably higher (45.0%) coverage of coding regions than of untranslated regions (24.5% of 5' and 32.7% of 3'UTRs). Lower sequence conservation between mouse and bank vole in untranslated regions was found to be partially responsible for poorer UTR representation. Our data might suggest a widespread transcription from noncoding genomic regions, a finding not reported in previous studies regarding transcriptomes in non-model organisms. We also identified over 19 thousand putative single nucleotide polymorphisms (SNPs). A much higher fraction of the SNPs than expected by chance exhibited variant frequency differences between selection regimes.
Conclusion: Longer reads and higher sequence yield per run provided by the 454 Titanium technology in comparison to earlier generations of pyrosequencing proved beneficial for the quality of assembly. An almost full representation of genes known to be expressed in the mouse heart was identified. Usage of the extensive genomic resources available for the house mouse, a moderately (20-40 mln years) divergent relative of the voles, enabled a comprehensive assessment of the transcript completeness. Transcript sequences generated in the present study allowed the identification of candidate SNPs associated with divergence of selection lines and constitute a valuable permanent resource forming a foundation for RNAseq experiments aiming at detection of adaptive changes both at the level of gene expression and sequence variants, that would facilitate studies of the genetic basis of evolutionary divergence.
Figures
References
Publication types
MeSH terms
LinkOut - more resources
Full Text Sources
Research Materials
