

Microarray analysis of relative gene expression stability for selection of internal reference genes in the rhesus macaque brain
- PMID: 20565976
- PMCID: PMC2914640
- DOI: 10.1186/1471-2199-11-47
Microarray analysis of relative gene expression stability for selection of internal reference genes in the rhesus macaque brain
Abstract
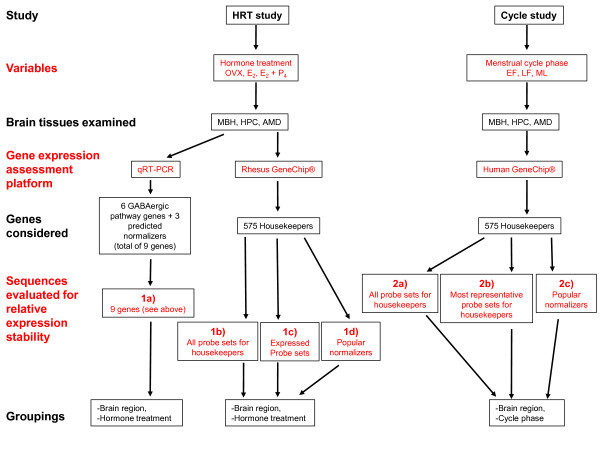
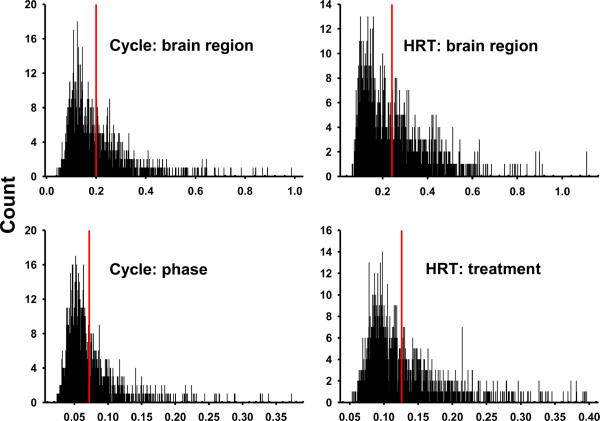
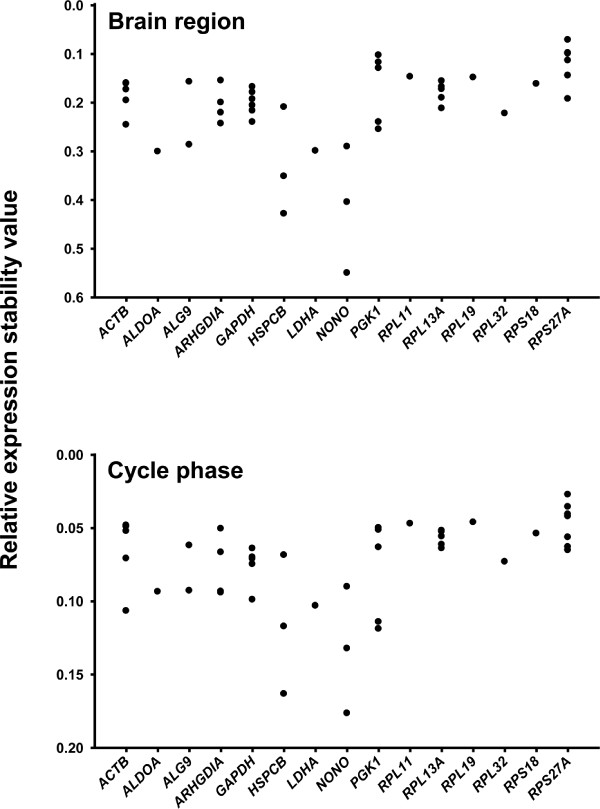
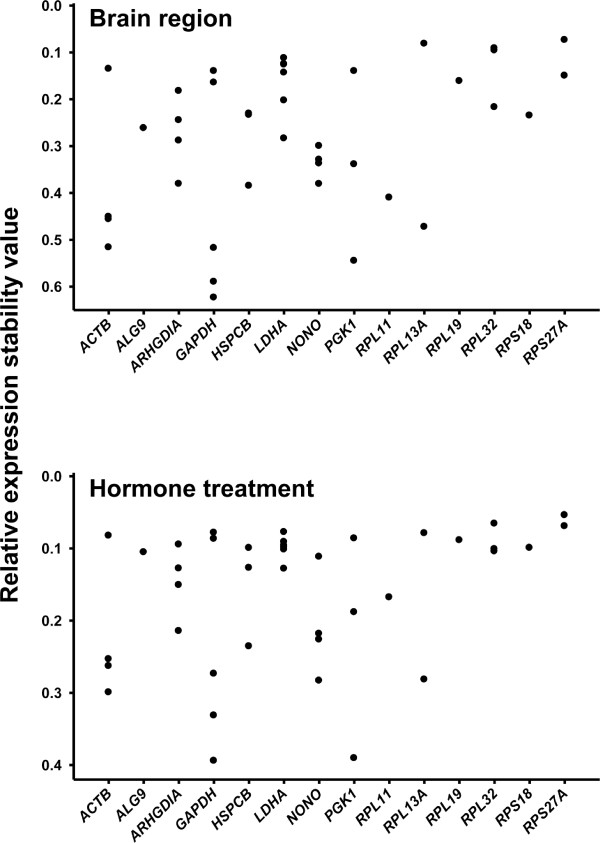
Background: Normalization of gene expression data refers to the comparison of expression values using reference standards that are consistent across all conditions of an experiment. In PCR studies, genes designated as "housekeeping genes" have been used as internal reference genes under the assumption that their expression is stable and independent of experimental conditions. However, verification of this assumption is rarely performed. Here we assess the use of gene microarray analysis to facilitate selection of internal reference sequences with higher expression stability across experimental conditions than can be expected using traditional selection methods.We recently demonstrated that relative gene expression from qRT-PCR data normalized using GAPDH, ALG9 and RPL13A expression values mirrored relative expression using quantile normalization in Robust Multichip Analysis (RMA) on the Affymetrix GeneChip rhesus Macaque Genome Array.Having shown that qRT-PCR and Affymetrix GeneChip data from the same hormone replacement therapy (HRT) study yielded concordant results, we used quantile-normalized gene microarray data to identify the most stably expressed among probe sets for prospective internal reference genes across three brain regions from the HRT study and an additional study of normally menstruating rhesus macaques (cycle study). Gene selection was limited to 575 previously published human "housekeeping" genes. Twelve animals were used per study, and three brain regions were analyzed from each animal. Gene expression stabilities were determined using geNorm, NormFinder and BestKeeper software packages.
Results: Sequences co-annotated for ribosomal protein S27a (RPS27A), and ubiquitin were among the most stably expressed under all conditions and selection criteria used for both studies. Higher annotation quality on the human GeneChip facilitated more targeted analysis than could be accomplished using the rhesus GeneChip. In the cycle study, multiple probe sets annotated for actin, gamma 1 (ACTG1) showed high signal intensity and were among the most stably expressed.
Conclusions: Using gene microarray analysis, we identified genes showing high expression stability under various sex-steroid environments in different regions of the rhesus macaque brain. Use of quantile-normalized microarray gene expression values represents an improvement over traditional methods of selecting internal reference genes for PCR analysis.
Figures
Similar articles
-
Selection of internal reference genes for SYBR green qRT-PCR studies of rhesus monkey (Macaca mulatta) tissues.BMC Mol Biol. 2008 Sep 10;9:78. doi: 10.1186/1471-2199-9-78. BMC Mol Biol. 2008. PMID: 18782457 Free PMC article.
-
Validation of reference genes aiming accurate normalization of qRT-PCR data in Dendrocalamus latiflorus Munro.PLoS One. 2014 Feb 3;9(2):e87417. doi: 10.1371/journal.pone.0087417. eCollection 2014. PLoS One. 2014. PMID: 24498321 Free PMC article.
-
Validation of Reference Genes for Normalization of Relative qRT-PCR Studies in Papillary Thyroid Carcinoma.Sci Rep. 2019 Oct 23;9(1):15241. doi: 10.1038/s41598-019-49247-1. Sci Rep. 2019. PMID: 31645594 Free PMC article.
-
Un-biased housekeeping gene panel selection for high-validity gene expression analysis.Sci Rep. 2022 Jul 19;12(1):12324. doi: 10.1038/s41598-022-15989-8. Sci Rep. 2022. PMID: 35853974 Free PMC article.
-
Applying Multivariate Adaptive Splines to Identify Genes With Expressions Varying After Diagnosis in Microarray Experiments.Cancer Inform. 2017 May 4;16:1176935117705381. doi: 10.1177/1176935117705381. eCollection 2017. Cancer Inform. 2017. PMID: 28579740 Free PMC article. Review.
Cited by
-
Relationship closeness buffers the effects of perceived stress on transcriptomic indicators of cellular stress and biological aging marker p16INK4a.Aging (Albany NY). 2020 Jul 26;12(16):16476-16490. doi: 10.18632/aging.103739. Epub 2020 Jul 26. Aging (Albany NY). 2020. PMID: 32712602 Free PMC article.
-
Androgens regulate gene expression in avian skeletal muscles.PLoS One. 2012;7(12):e51482. doi: 10.1371/journal.pone.0051482. Epub 2012 Dec 17. PLoS One. 2012. PMID: 23284699 Free PMC article.
-
Adenosine receptor distribution in Rhesus monkey ocular tissue.Exp Eye Res. 2018 Sep;174:40-50. doi: 10.1016/j.exer.2018.05.020. Epub 2018 May 21. Exp Eye Res. 2018. PMID: 29792846 Free PMC article.
-
Glucan Biosynthesis Protein G Is a Suitable Reference Gene in Escherichia coli K-12.ISRN Microbiol. 2011 Nov 23;2011:469053. doi: 10.5402/2011/469053. Print 2011. ISRN Microbiol. 2011. PMID: 23724305 Free PMC article.
-
Association of microtubule associated protein-2, synaptophysin, and apolipoprotein E mRNA and protein levels with cognition and anxiety levels in aged female rhesus macaques.Behav Brain Res. 2012 Jun 15;232(1):1-6. doi: 10.1016/j.bbr.2012.03.032. Epub 2012 Mar 28. Behav Brain Res. 2012. PMID: 22475553 Free PMC article.
References
Publication types
MeSH terms
Grants and funding
LinkOut - more resources
Full Text Sources
Research Materials
