

Adaptation and diversity along an altitudinal gradient in Ethiopian barley (Hordeum vulgare L.) landraces revealed by molecular analysis
- PMID: 20565982
- PMCID: PMC3095281
- DOI: 10.1186/1471-2229-10-121
Adaptation and diversity along an altitudinal gradient in Ethiopian barley (Hordeum vulgare L.) landraces revealed by molecular analysis
Abstract
Background: Among the cereal crops, barley is the species with the greatest adaptability to a wide range of environments. To determine the level and structure of genetic diversity in barley (Hordeum vulgare L.) landraces from the central highlands of Ethiopia, we have examined the molecular variation at seven nuclear microsatellite loci.
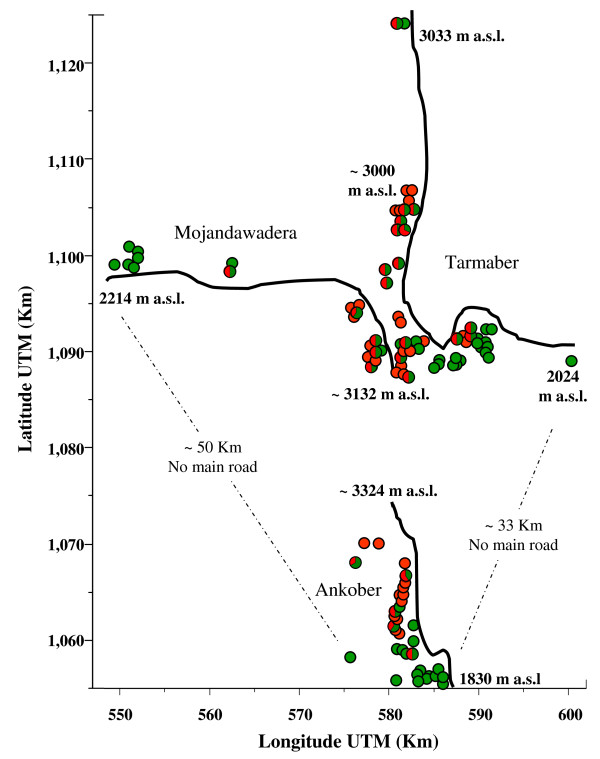
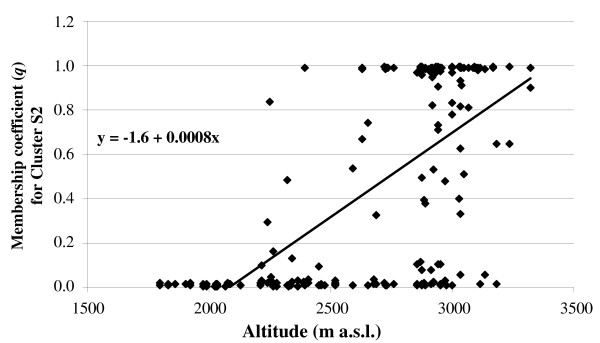
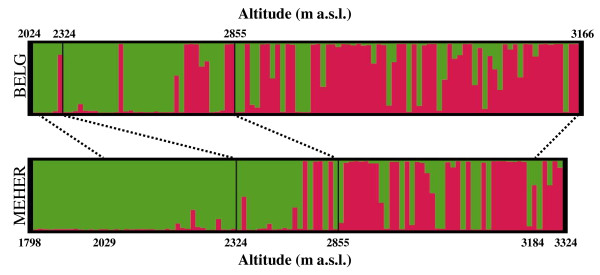
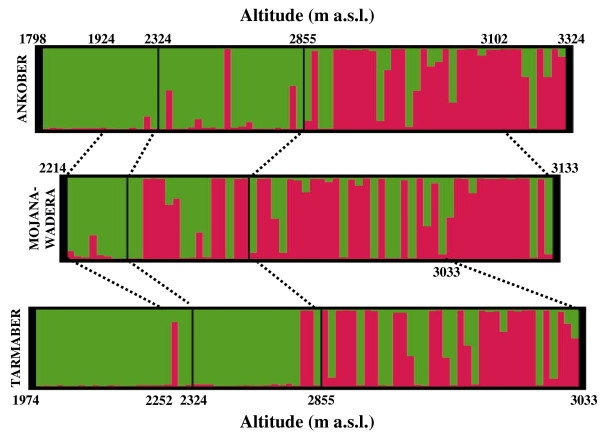
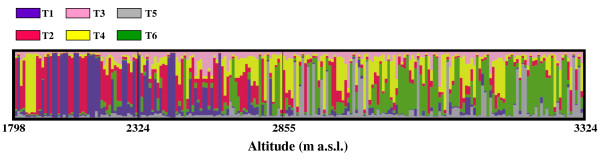
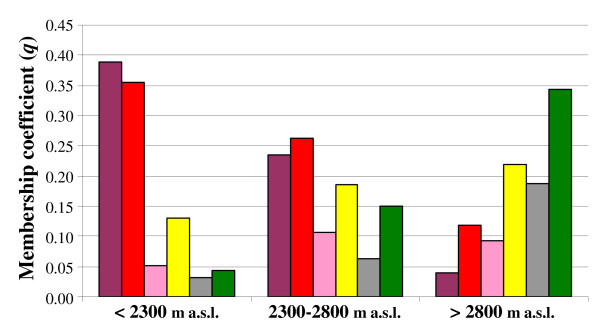
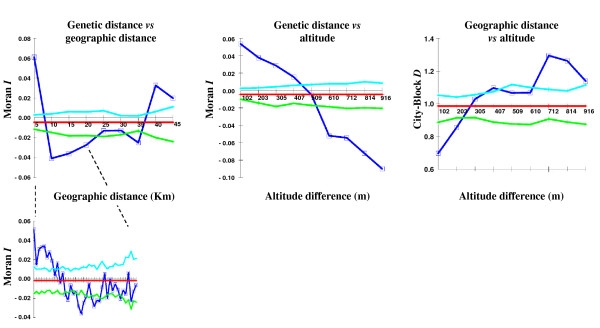
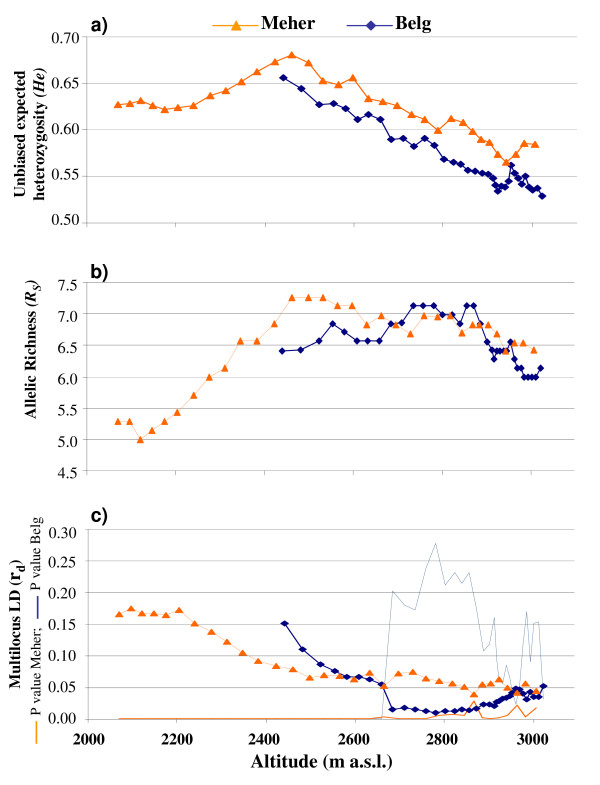
Results: A total of 106 landrace populations were sampled in the two growing seasons (Meher and Belg; the long and short rainy seasons, respectively), across three districts (Ankober, Mojanawadera and Tarmaber), and within each district along an altitudinal gradient (from 1,798 to 3,324 m a.s.l). Overall, although significant, the divergence (e.g. FST) is very low between seasons and geographical districts, while it is high between different classes of altitude. Selection for adaptation to different altitudes appears to be the main factor that has determined the observed clinal variation, along with population-size effects.
Conclusions: Our data show that barley landraces from Ethiopia are constituted by highly variable local populations (farmer's fields) that have large within-population diversity. These landraces are also shown to be locally adapted, with the major driving force that has shaped their population structure being consistent with selection for adaptation along an altitudinal gradient. Overall, our study highlights the potential of such landraces as a source of useful alleles. Furthermore, these landraces also represent an ideal system to study the processes of adaptation and for the identification of genes and genomic regions that have adaptive roles in crop species.
Figures
Similar articles
-
Assessment on the Current State of On-Farm Diversity and Genetic Erosion in Barley (Hordeum vulgare L.) Landraces from Bale Highlands, Southeast Ethiopia.Biomed Res Int. 2021 Feb 23;2021:6677363. doi: 10.1155/2021/6677363. eCollection 2021. Biomed Res Int. 2021. PMID: 33681372 Free PMC article.
-
Genetic association with high-resolution climate data reveals selection footprints in the genomes of barley landraces across the Iberian Peninsula.Mol Ecol. 2019 Apr;28(8):1994-2012. doi: 10.1111/mec.15009. Epub 2019 Apr 2. Mol Ecol. 2019. PMID: 30614595 Free PMC article.
-
Genetic relatedness and population differentiation of Himalayan hulless barley (Hordeum vulgare L.) landraces inferred with SSRs.Theor Appl Genet. 2006 Aug;113(4):715-29. doi: 10.1007/s00122-006-0340-0. Epub 2006 Jul 15. Theor Appl Genet. 2006. PMID: 16845521
-
Barley: a translational model for adaptation to climate change.New Phytol. 2015 May;206(3):913-931. doi: 10.1111/nph.13266. Epub 2015 Jan 21. New Phytol. 2015. PMID: 25605349 Review.
-
Heritage genetics for adaptation to marginal soils in barley.Trends Plant Sci. 2023 May;28(5):544-551. doi: 10.1016/j.tplants.2023.01.008. Epub 2023 Feb 27. Trends Plant Sci. 2023. PMID: 36858842 Review.
Cited by
-
Genetic diversity and population structure in a legacy collection of spring barley landraces adapted to a wide range of climates.PLoS One. 2014 Dec 26;9(12):e116164. doi: 10.1371/journal.pone.0116164. eCollection 2014. PLoS One. 2014. PMID: 25541702 Free PMC article.
-
A 25K Wheat SNP Array Revealed the Genetic Diversity and Population Structure of Durum Wheat (Triticum turgidum subsp. durum) Landraces and Cultivars.Int J Mol Sci. 2025 Jul 25;26(15):7220. doi: 10.3390/ijms26157220. Int J Mol Sci. 2025. PMID: 40806351 Free PMC article.
-
European Phaseolus coccineus L. landraces: population structure and adaptation, as revealed by cpSSRs and phenotypic analyses.PLoS One. 2013;8(2):e57337. doi: 10.1371/journal.pone.0057337. Epub 2013 Feb 22. PLoS One. 2013. PMID: 23451209 Free PMC article.
-
Genome-Wide Detection of Genes Under Positive Selection in Worldwide Populations of the Barley Scald Pathogen.Genome Biol Evol. 2018 Apr 1;10(5):1315-1332. doi: 10.1093/gbe/evy087. Genome Biol Evol. 2018. PMID: 29722810 Free PMC article.
-
Genetic structure and linkage disequilibrium in landrace populations of barley in Sardinia.Theor Appl Genet. 2012 Jun;125(1):171-84. doi: 10.1007/s00122-012-1824-8. Epub 2012 Mar 13. Theor Appl Genet. 2012. PMID: 22411093
References
-
- Matz SA. The Chemistry and Technology of Cereals as Food and Feed. Van Nostrand Reinhold: New York; 1991.
-
- von Bothmer R, Sato K, Komatsudam T, Yasuda S, Fischbeck G. In: Diversity in barley (Hordeum vulgare) von Bothmer R, van Hintum T, Knüpffer H, Sato K, editor. Amsterdam: Elsevier Science BV; 2003. The domestication of cultivated barley; pp. 9–27. full_text.
-
- Asfaw Z. In: Genes in the Field: On-farm Conservation of Crop Diversity. Brush SB, editor. Boca Raton, Florida, USA: Lewis Publisher; 2000. The barleys of Ethiopia; pp. 77–108.
-
- Lynch M, Walsh B. Genetics and Analysis of Quantitative Traits. Sunderland, MA, USA: Sinauer Associates; 1997.
Publication types
MeSH terms
Substances
LinkOut - more resources
Full Text Sources
Miscellaneous
