

Single versus multi-dose vaccine vials: an economic computational model
- PMID: 20566395
- PMCID: PMC2919154
- DOI: 10.1016/j.vaccine.2010.05.048
Single versus multi-dose vaccine vials: an economic computational model
Abstract
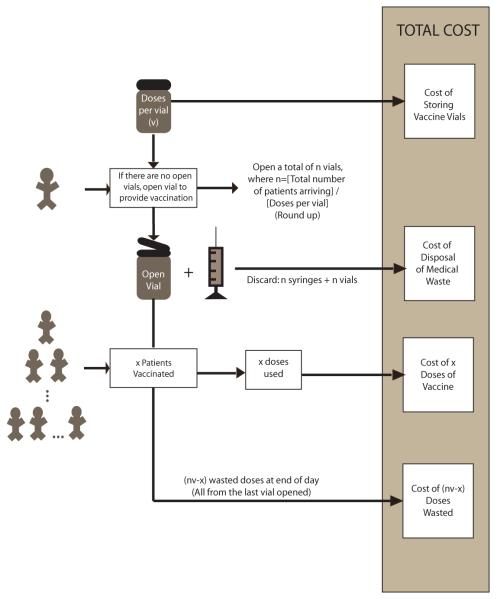
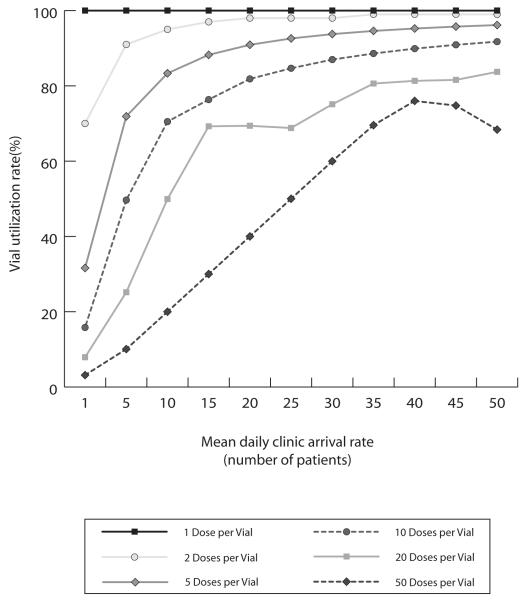
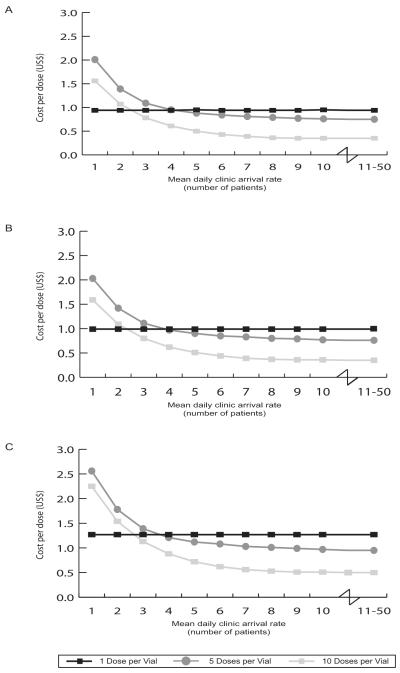
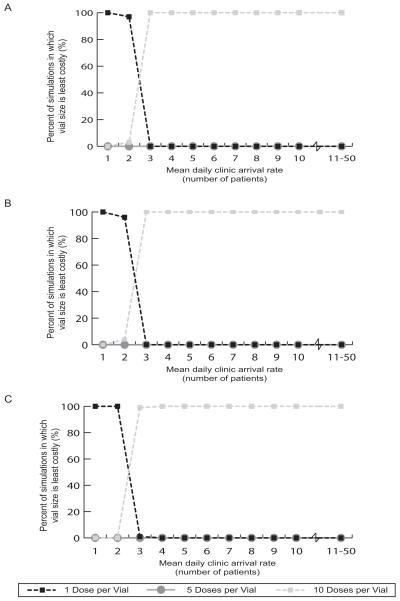
Single-dose vaccine formats can prevent clinic-level vaccine wastage but may incur higher production, medical waste disposal, and storage costs than multi-dose formats. To help guide vaccine developers, manufacturers, distributors, and purchasers, we developed a computational model to predict the potential economic impact of various single-dose versus multi-dose measles (MEA), hemophilus influenzae type B (Hib), Bacille Calmette-Guérin (BCG), yellow fever (YF), and pentavalent (DTP-HepB-Hib) vaccine formats. Lower patient demand favors fewer dose formats. The mean daily patient arrival thresholds for each vaccine format are as follows: for the MEA vaccine, 2 patients/day (below which the single-dose vial and above which the 10-dose vial are least costly); BCG vaccine, 6 patients/day (below, 10-dose vial; above, 20-dose vial); Hib vaccine, 5 patients/day (below, single-dose vial; above, 10-dose vial); YF vaccine, 33 patients/day (below, 5-dose vials; above 50-dose vial); and DTP-HepB-Hib vaccine, 5 patients/day (below, single-dose vial; above, 10-dose vial).
(c) 2010 Elsevier Ltd. All rights reserved.
Figures
References
-
- World Health Organization Vaccine Volume Calculator. 2009. cited 2010 February 20, 2010]; Immunization service delivery and accelerated disease control]. Available from: http://www.who.int/immunization_delivery/systems_policy/logistics/en/ind....
-
- Parmar D, Baruwa EM, Zuber P, Kone S. Impact of wastage on single and multidose vaccine vials: Implications for introducing pneumococcal vaccines in developing countries. Hum Vaccin. 2010 Mar 21;6(3) - PubMed
-
- Gooding J, Millage A, Rye AK, Lacroix R. The cost and safety of multidose use of palivizumab vials. Clin Pediatr (Phila) 2008 Mar;47(2):160–3. - PubMed
-
- Griffiths UK, Korczak VS, Ayalew D, Yigzaw A. Incremental system costs of introducing combined DTwP-hepatitis B-Hib vaccine into national immunization services in Ethiopia. Vaccine. 2009 Feb 25;27(9):1426–32. - PubMed
Publication types
MeSH terms
Substances
Grants and funding
LinkOut - more resources
Full Text Sources
Other Literature Sources
Medical
