. 2010 Sep 3;285(36):27536-44.
doi: 10.1074/jbc.M110.130955. Epub 2010 Jun 21.

Escherichia coli cell surface perturbation and disruption induced by antimicrobial peptides BP100 and pepR

Affiliations

Escherichia coli cell surface perturbation and disruption induced by antimicrobial peptides BP100 and pepR

Carla S Alves et al. J Biol Chem. .

Abstract

The potential of antimicrobial peptides (AMPs) as an alternative to conventional therapies is well recognized. Insights into the biological and biophysical properties of AMPs are thus key to understanding their mode of action. In this study, the mechanisms adopted by two AMPs in disrupting the gram-negative Escherichia coli bacterial envelope were explored. BP100 is a short cecropin A-melittin hybrid peptide known to inhibit the growth of phytopathogenic gram-negative bacteria. pepR, on the other hand, is a novel AMP derived from the dengue virus capsid protein. Both BP100 and pepR were found to inhibit the growth of E. coli at micromolar concentrations. Zeta potential measurements of E. coli incubated with increasing peptide concentrations allowed for the establishment of a correlation between the minimal inhibitory concentration (MIC) of each AMP and membrane surface charge neutralization. While a neutralization-mediated killing mechanism adopted by either AMP is not necessarily implied, the hypothesis that surface neutralization occurs close to MIC values was confirmed. Atomic force microscopy (AFM) was then employed to visualize the structural effect of the interaction of each AMP with the E. coli cell envelope. At their MICs, BP100 and pepR progressively destroyed the bacterial envelope, with extensive damage already occurring 2 h after peptide addition to the bacteria. A similar effect was observed for each AMP in the concentration-dependent studies. At peptide concentrations below MIC values, only minor disruptions of the bacterial surface occurred.


Figures
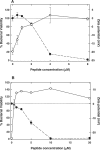
FIGURE 1.
FIGURE 1.
Effect of AMP treatment on the bacterial viability and zeta potential properties of E. coli. A and B, E. coli was treated with BP100 (A) and pepR (B). Peptide concentrations of 0.5, 1, 2, 4, and 8 μm were tested for BP100, and 0.63, 1.25, 2.5, 5, 10, and 20 μm for pepR. Dashed lines (–•–) correspond to the percentage of viable bacterial cells in the presence of increasing peptide concentrations, while the zeta potential is indicated by the solid lines (—○—). The dotted line both in A and B indicates a neutral surface net charge, to highlight the peptide concentration range at which E. coli surface neutrality and possible overcompensation are achieved. In each case, each value represents the mean of duplicate determinations. Error bars represent the S.E.
FIGURE 2.
FIGURE 2.
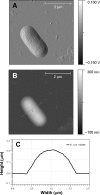
AFM images of an untreated E. coli cell dried in air. A and B, lock-in-amplitude image (A) and topography image (B) of E. coli. Total scanning area for each image: 4 × 4 μm2. C, cross-section of image indicated in B, providing a quantitative measure of the bacterial cell dimensions.
FIGURE 3.
FIGURE 3.
Time dependence of AMP effects on E. coli imaged by AFM. A–I, three-dimensional orthogonal projection images (derived from the height data) of untreated E. coli cells (top row), and E. coli cells treated with 3 μm BP100 (middle row), and 5 μm pepR (bottom row). Images were acquired following the treatment of the bacterial cells for 0.5 h (first column), 2 h (second column), and 5 h (third column). Total scanning area for each image: 4 × 4 μm2. See the text for a description of the highlighted areas.
FIGURE 4.
FIGURE 4.
Concentration dependence of AMP effects on E. coli imaged by AFM. A–F. Three-dimensional orthogonal projection images (derived from the height data) of E. coli cells incubated for 2 h with either BP100 (top row) or pepR (bottom row) using concentrations below, at, and above MIC values. For BP100, 0.3 μm (A), 3 μm (B), and 8 μm (C) concentrations were tested, while for pepR 0.5 μm (D), 5 μm (E), and 20 μm (F) concentrations were used. Total scanning area for each image: 4 × 4 μm2. See the text for a description of the highlighted areas.
FIGURE 5.
FIGURE 5.
Surface roughness analysis procedure applied to the AFM images. A–D, originally acquired AFM height image of E. coli (A) was treated, through the application of a mean filter, to estimate the bacterial cell form (B). The treated image data (B) was then subtracted from the original height image data (A). The resultant flattened image of the bacterial cell surface (C) was then analyzed by measuring the root-mean-square value (Rrms) of the height distribution over the entire bacterial cell surface, on areas with a fixed size of 125 × 125 nm2 (D).
FIGURE 6.
FIGURE 6.
E. coli cell surface topography analysis. The average surface roughness of the untreated E. coli cells, and the E. coli cells treated with either BP100 or pepR were compared. The AFM height images evaluated for BP100 were those of E. coli treated with either 0.3 μm (below MIC) or 3 μm (at MIC) concentrations. For pepR, the height images evaluated were those of E. coli treated with either 0.5 μm (below MIC) or 5 μm (at MIC) concentrations. The surface roughness of E. coli when treated with either AMP using concentrations equivalent to MIC values was significantly enhanced: **, p < 0.05 for 3 μm BP100 when compared with either the untreated cells or the cells treated with 0.3 μm BP100; ***, p < 0.0005 for 5 μm pepR when compared with either the untreated cells or the cells treated with 0.5 μm pepR. Error bars indicate the S.E.

Similar articles

Cited by

References

    1. Zasloff M. (2002) Nature 415, 389–395 - PubMed
    1. Brogden K. A. (2005) Nat. Rev. Microbiol. 3, 238–250 - PubMed
    1. Yeaman M. R., Yount N. Y. (2003) Pharmacol. Rev. 55, 27–55 - PubMed
    1. Jenssen H., Hamill P., Hancock R. E. W. (2006) Clin. Microbiol. Rev. 19, 491–511 - PMC - PubMed
    1. Hancock R. E., Chapple D. S. (1999) Antimicrob. Agents Chemother. 43, 1317–1323 - PMC - PubMed

Publication types

MeSH terms

Substances

LinkOut - more resources