. 2010 Aug 20;285(34):26049-57.
doi: 10.1074/jbc.M110.105346. Epub 2010 Jun 21.

Nicotinic receptor subunit alpha5 modifies assembly, up-regulation, and response to pro-inflammatory cytokines

Affiliations

Nicotinic receptor subunit alpha5 modifies assembly, up-regulation, and response to pro-inflammatory cytokines

Lorise C Gahring et al. J Biol Chem. .

Abstract

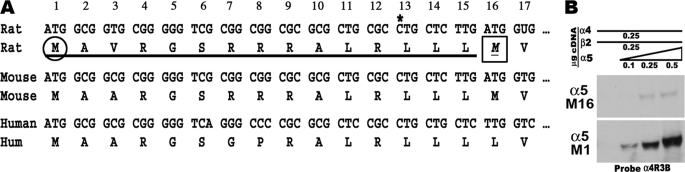
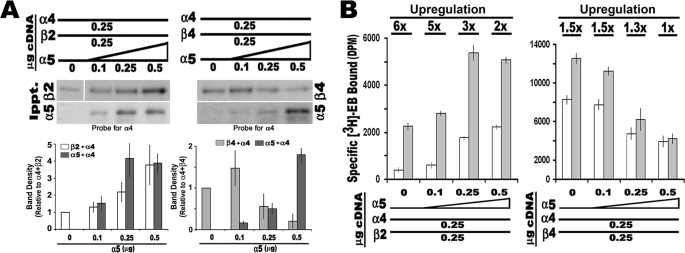
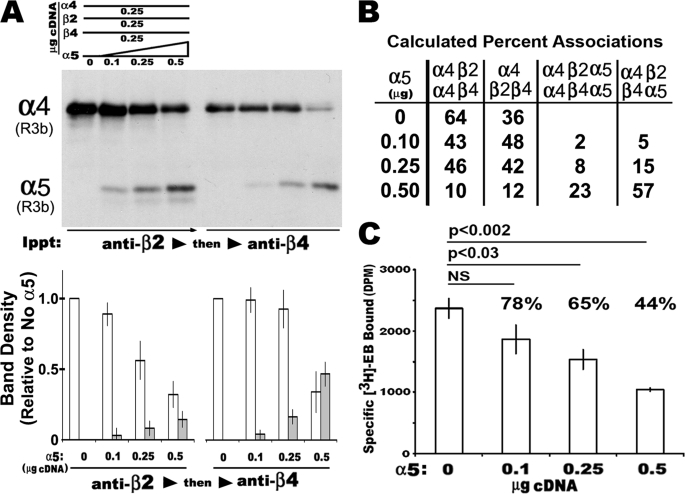
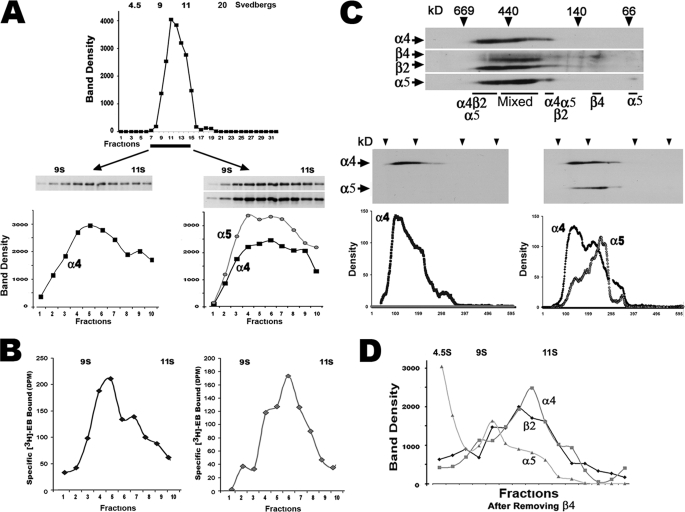
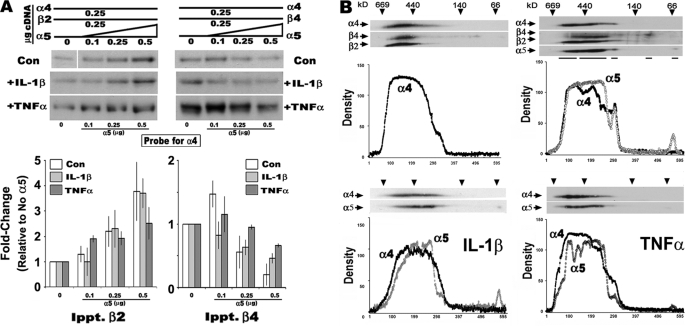
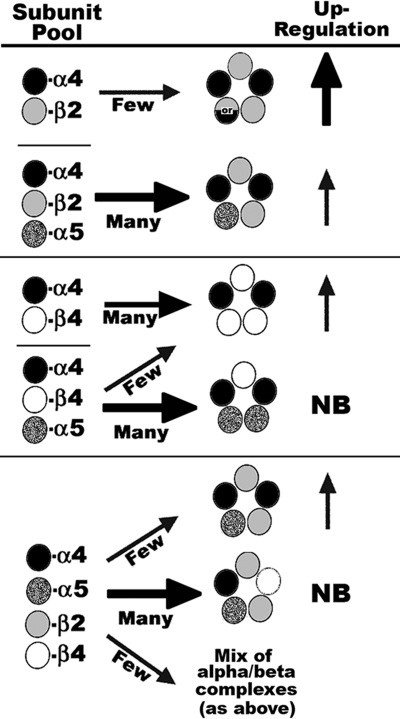
In the mammalian brain high affinity nicotine-binding sites are composed of at least the alpha4 and beta2 subunits. Additional nicotinic acetylcholine receptor subunits that are often co-expressed with alpha4+beta2 include alpha5. The introduction of alpha5 into 293 cells expressing alpha4+beta2 strongly favors assembly of alpha4+alpha5+beta2 receptors, increases constitutive ligand binding density as measured using [(3)H]epibatidine, but reduces the magnitude of up-regulation in response to chronic nicotine. In contrast, when beta4 is substituted for beta2, alpha5 interferes with the assembly of these receptors, demonstrating an important role for the beta subunit in this process. When cells co-express alpha4+alpha5+beta2+beta4, over 50% of the subunit associations include all four subunits, but they fail to be detected using [(3)H]epibatidine binding. However, complexes of alpha4+alpha5+beta2 do preferentially emerge from these subunit mixtures, and these mixtures bind ligand. In previous studies of alpha4+beta2+beta4 co-expression by 293 cells, the inflammatory cytokines IL-1beta and TNFalpha influenced the outcome of receptor assembly (Gahring, L. C., Days, E. L., Kaasch, T., González de Mendoza, M., Owen, L., Persiyanov, K., and Rogers, S. W. (2005) J. Neuroimmunol. 166, 88-101). When alpha5 is included in this subunit mixture, and cells are exposed to either inflammatory cytokine, subunit association is no longer altered. These findings suggest that alpha5 is an influential modulator of alpha4+beta2 nicotinic acetylcholine receptor assembly and stabilizes their expression in response to fluctuations in external conditions.


Figures

FIGURE 1.
FIGURE 1.
Definition of the α5 leader sequence used for expression in transfected cells. (A) In the original rat expression clone of α5 (PC989E(4)), there is an omission of the cytosine base identified by an asterisk that lead to a subcloned variant that lacked the first methionine (circled), thus forcing sole translation of the α5 cDNA protein product to initiate from the second methionine (boxed and identified as Met16). This sequence was corrected through RT-PCR methods of native α5 mRNA (see “Experimental Procedures”) to generate a cDNA that includes the longer α5, including an initiating methionine at residue 1 (circled). This also brings the α5 cDNA into agreement with those from the mouse (GenBankTM DQ318788 and C57BL6/J) and human (GenBankTM NM_000745), respectively. (B) As shown using Western blot analysis of 293 cells transfected with α4+β2 and either the corrected α5 or the Met16 start methionine, expression of α5 can proceed from either methionine, although the first initiating methionine is clearly favored.
FIGURE 2.
FIGURE 2.
The α5 subunit enters into stable complexes with α4 and up-regulation to nicotine is reduced. 293 cells were co-transfected with varying amounts of α5 cDNA (as indicated) with constant cDNA amounts for either α4 and β2 or α4 and β4, respectively. A, immunoprecipitation with either anti-α5 or the appropriate anti-β subunit was followed by Western blot analysis to determine the amount of associated α4. Quantitation of the blots in this panel shows that as the amount of α5 cDNA co-transfected with α4+β2 subunit is increased, associations between α4 and both β2 and α5, respectively, also increase. In contrast, when β4 is substituted for β2, the amount of α4 associated with β4 diminishes, whereas α5 is enhanced. All of the values were normalized to the no α5 input values, and the error bars were calculated and are shown as ± S.E. for the results from three to seven independent experiments. B, [3H]EB ligand binding to membranes from cells transfected as in A and membranes from cells treated with 1 μm nicotine (gray bars). Increased α5 corresponds with decreased up-regulation induced by nicotine (fold increase is noted above each treatment set). Each experiment was conducted three to eight times, and the error bars reflect ± S.E. for all experiments.
FIGURE 3.
FIGURE 3.
The α5 subunit alters the relative subunit association among α4+β2+β4. Increasing amounts of α5 were co-transfected with fixed amounts of α4, β2, and β4 cDNA (0.25 μg of each). Crude membranes were solubilized in detergent and subjected to progressive immunoprecipitation with either anti-β2 followed by anti-β4 or reciprocally anti-β4 followed by anti-β2 as described (see “Experimental Procedures”). A, representative results from cells transfected as described above. A Western blot reveals the relative amount of R3b epitope-tagged α4 or α5 as indicated in association with β2 or β4 after removal of all β2 complexes. Quantitation of these blots is shown where all of the values are normalized to samples with no α5 co-transfected. The error bars reflect plus or minus the standard error of the mean as calculated from three independent experiments done in the same manner. B, average percentages of the relative amounts of mixed subunit complexes that were either directly measured or derived from measuring the relative amount of α4 remaining after successive anti-β subunit immunoprecipitations as in A. The averages are from three independent experiments. C, ligand binding ([3H]EB) to total membranes decreases as α5 input is increased. The loss of ∼56% of the total radioligand binding relative to non-α5 transfection mixtures corresponds well with the increase of α4α5β2β4 complexes (B).
FIGURE 4.
FIGURE 4.
Sucrose density gradients and two-dimensional BNG reveals ligand-binding sites of the α4+α5+β2 subunit composition. A, cells were transfected with equal amounts of cDNA (0.25 μg of each) encoding α4R3b and β2-HA with or without α5R3b. Solubilized membranes from these cells were subjected to sucrose gradient sedimentation, and gradient fractions were collected for analysis of the epitope marked α4 and α5 subunits (when present) using SDS-PAGE gel electrophoresis. As shown, the majority of α4 is localized to fractions consistent with a 10 S complex. The profile revealed by α4 immunoreactivity results when gradient resolution between the 9–11 S markers is increased. When α5 is included in the transfection mixtures, there is a broadening of the sedimentation profile curve to include a new distribution covering the 10–10.5 S range. B, the corresponding [3H]EB binding to similar gradient fractions is shown. Inclusion of α5 increases the amount of ligand bound to the 10.5 S peak over the 10 S peak similar to the distribution of the α4 or α4+α5, respectively, measured by Western blots. C, mixtures of α4+α5+β2+β4 were co-transfected, and the cell membranes were prepared for two-dimensional BNG analysis. All of the subunits were detected using Western blot analysis for epitope-tagged β2 and β4 followed by stripping and reprobing to reveal both epitope-tagged α subunits. The gel was then reassembled electronically to show all of the subunits as identified. Most immunoreactivity is of various (mixed) subunit composition, although two major complexes (designated as α4α5β2) do not appear to include β4. Possible β4 dimers and α5 monomers are marked. In the lower left gel, α5 was omitted from the subunit co-transfection mixture (only α4 is shown for clarity); the majority of α4 resides in a smear of complexes, although a prominent peak of immunoreactivity as measured in the gel densitometry tracing below the blot is observed. However, when α5 is included in the transfection mixture, the molecular weight of the overall complex is shifted to add a “lower” molecular weight component that includes both α4 and α5 species. These are the same complexes that are dominated by the presence of α4+α5+β2 in the reference gel above. D, to determine whether α4+α5+β2 subunits are present, α4+α5+β2+β4 were co-transfected (equivalent amounts of cDNA as above) only before separating the complexes on sucrose gradients, complexes harboring β4 were removed using anti-β4 immunoprecipitation. The remaining complexes were then separated on a sucrose gradients, the fractions were collected, the Western blots were prepared, and the density traces of the two-dimensional analysis were done as in C. As shown in the line profiles, two prominent peaks of the remaining α4, α5, and β2 were present that include one at the 10.5 S peak and another near 10 S. A third and smaller peak found in immunoprecipitated samples was composed of mixed subunits of near equivalent amounts at ∼9.5 S and presumed monomers of α5 near the top of the gradient. The results reflect data collected from between two and six independently performed experiments.
FIGURE 5.
FIGURE 5.
The presence of α5 moderates the influence of the pro-inflammatory cytokines IL-1β and TNFα on nAChR receptor assembly. A, similar to experiments in Fig. 2 only IL-β or TNFα was added for the duration of the transfection (control gels are the same as in Fig. 2). Western blot analysis of cells co-transfected with fixed amounts of α4 and the indicated β subunit and increasing amounts of α5 cDNA. The relative amount of association of α4 with the indicated β subunit is detected using Western blot, and the relative band density is plotted. B, in similar experiments cell membranes were examined by two-dimensional BNG analysis, and the results for just α4 and α5 are shown for clarity. Plots of α4 immunoreactivity in cells treated with either IL-β or TNFα and co-transfected with α5 or not co-transfected (as labeled) are placed below the blots. Control experiments were conducted between three and eight times as in Fig. 2. Cytokine experiments are based upon an n value of 3.
FIGURE 6.
FIGURE 6.
Model of α5 impact upon assembly of nAChRs. Depending upon the β subunit (either β2 or β4), the relative outcome of assembly with α4 varies dramatically when α5 is included in the mixture. Although α4+β2 does assemble to bind ligand with high affinity (as indicated by upward arrows), α5 favors this assembly through possibly filling the fifth position in nAChR assembly. The relative level of up-regulation is indicated by the size and thickness of the arrow. Two possible stoichiometries for α4+β2 receptors that were not investigated in this study are designated by the mixed circle containing or (31). In α4+β4 mixtures, α5 competes with β4 for binding to α4, resulting in reduced complexes detected by ligand binding. Although assembly of α4+β2 containing nAChRs is favored by α5, this decreases the relative amount of up-regulation promoted by nicotine because this subunit takes the place of nicotine in stabilizing or promoting expression of maturing nAChR complexes. The majority of complexes formed from co-transfection of α4+α5+β2+β4 result in mostly subunit associations that are not detected by ligand binding. NB, no binding. However, these mixtures also give rise to α4+β4±α5 complexes and α4+α5+β2 complexes, which dominate ligand binding measurements.

Similar articles

Cited by

References

    1. Schwartz R. D., Kellar K. J. (1985) J. Neurochem. 45, 427–433 - PubMed
    1. Marks M. J., Stitzel J. A., Collins A. C. (1985) J. Pharmacol. Exp. Ther. 235, 619–628 - PubMed
    1. Whiting P., Lindstrom J. (1987) Proc. Natl. Acad. Sci. U.S.A. 84, 595–599 - PMC - PubMed
    1. Flores C. M., Rogers S. W., Pabreza L. A., Wolfe B. B., Kellar K. J. (1992) Mol. Pharmacol. 41, 31–37 - PubMed
    1. Picciotto M. R., Zoli M., Changeux J. P. (1999) Nicotine Tob. Res. Suppl. 2, S121–S125 - PubMed

Publication types

LinkOut - more resources