. 2010 Aug 20;285(34):26315-25.
doi: 10.1074/jbc.M110.104547. Epub 2010 Jun 21.

Identification of a substrate-binding site in a peroxisomal beta-oxidation enzyme by photoaffinity labeling with a novel palmitoyl derivative

Affiliations

Identification of a substrate-binding site in a peroxisomal beta-oxidation enzyme by photoaffinity labeling with a novel palmitoyl derivative

Yoshinori Kashiwayama et al. J Biol Chem. .

Abstract

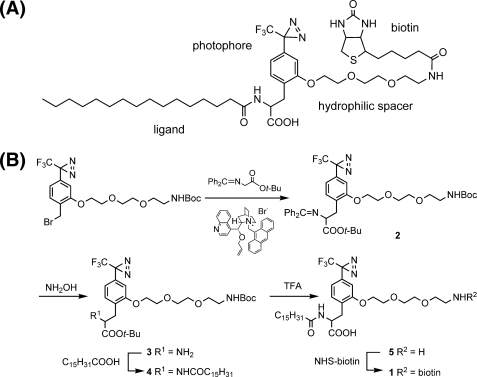
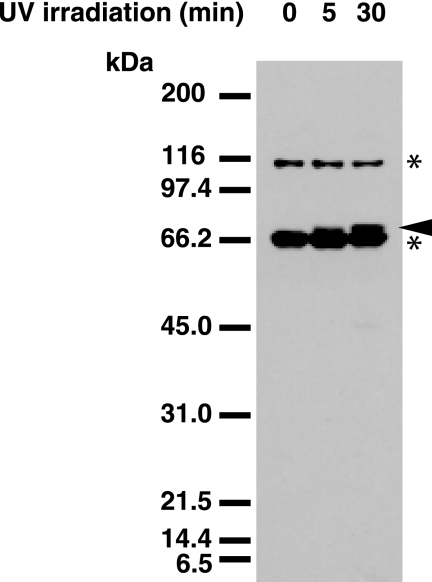
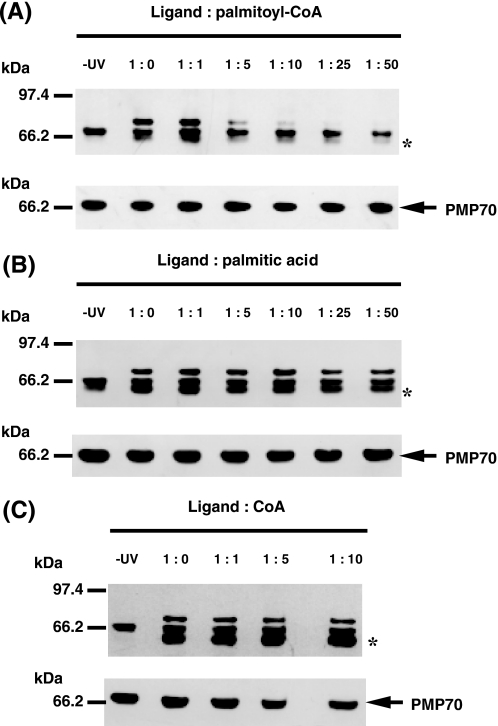
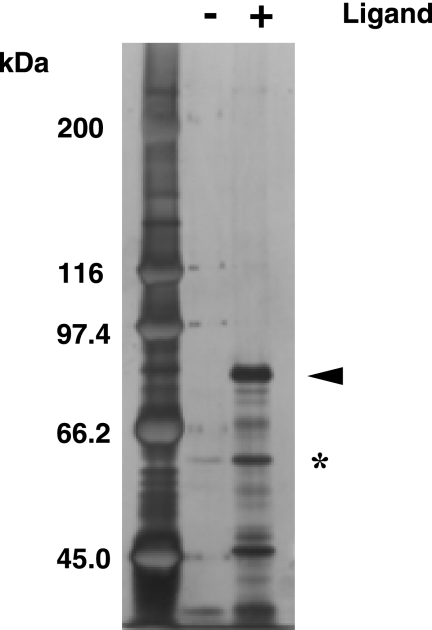
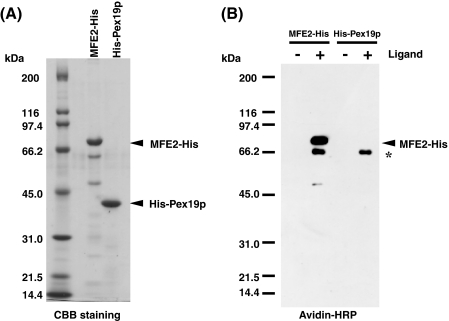
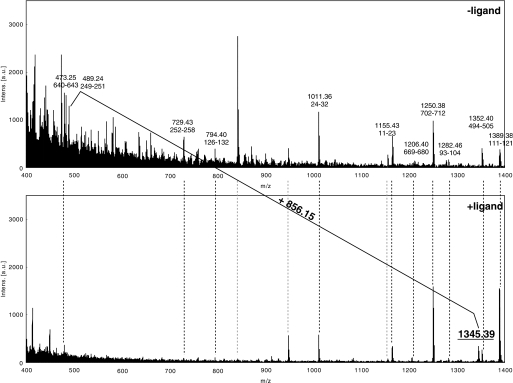
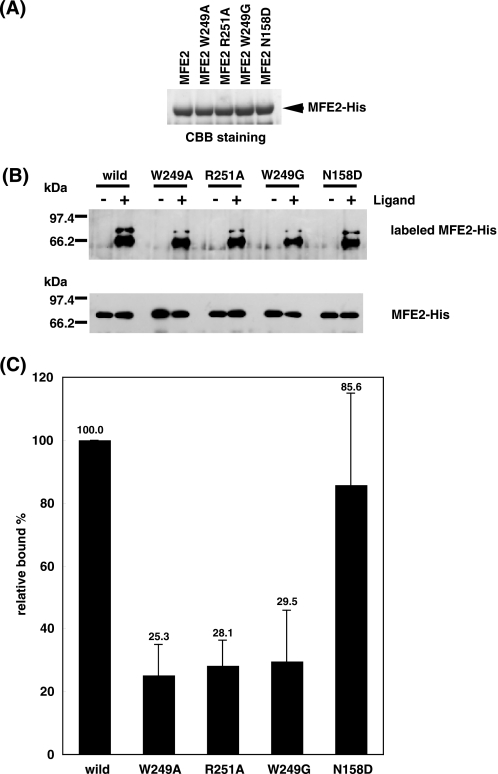
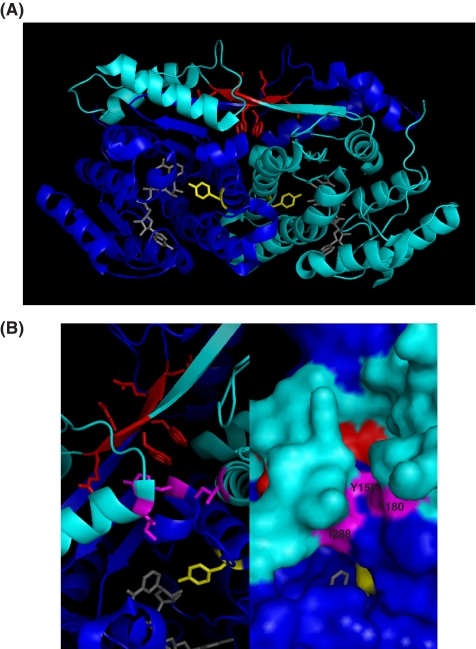
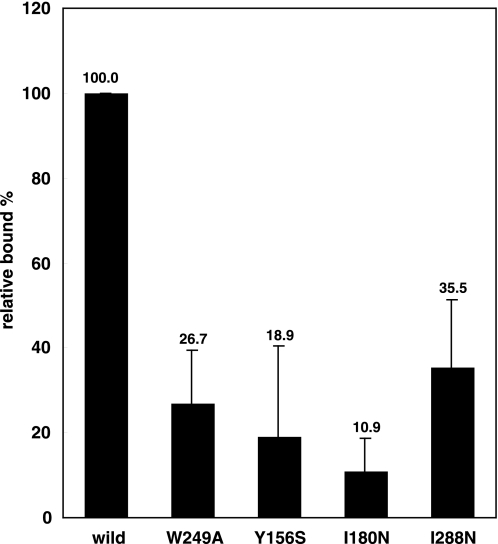
Peroxisomes play an essential role in a number of important metabolic pathways including beta-oxidation of fatty acids and their derivatives. Therefore, peroxisomes possess various beta-oxidation enzymes and specialized fatty acid transport systems. However, the molecular mechanisms of these proteins, especially in terms of substrate binding, are still unknown. In this study, to identify the substrate-binding sites of these proteins, we synthesized a photoreactive palmitic acid analogue bearing a diazirine moiety as a photophore, and performed photoaffinity labeling of purified rat liver peroxisomes. As a result, an 80-kDa peroxisomal protein was specifically labeled by the photoaffinity ligand, and the labeling efficiency competitively decreased in the presence of palmitoyl-CoA. Mass spectrometric analysis identified the 80-kDa protein as peroxisomal multifunctional enzyme type 2 (MFE2), one of the peroxisomal beta-oxidation enzymes. Recombinant rat MFE2 was also labeled by the photoaffinity ligand, and mass spectrometric analysis revealed that a fragment of rat MFE2 (residues Trp(249) to Arg(251)) was labeled by the ligand. MFE2 mutants bearing these residues, MFE2(W249A) and MFE2(R251A), exhibited decreased labeling efficiency. Furthermore, MFE2(W249G), which corresponds to one of the disease-causing mutations in human MFE2, also exhibited a decreased efficiency. Based on the crystal structure of rat MFE2, these residues are located on the top of a hydrophobic cavity leading to an active site of MFE2. These data suggest that MFE2 anchors its substrate around the region from Trp(249) to Arg(251) and positions the substrate along the hydrophobic cavity in the proper direction toward the catalytic center.


Figures

FIGURE 1.
FIGURE 1.
Synthesis of photoreactive LCFA probe. A, structure of the photoreactive LCFA probe. B, synthetic scheme for the preparation of the photoreactive LCFA probe.
FIGURE 2.
FIGURE 2.
Photoaffinity labeling of rat liver peroxisomes. Purified rat liver peroxisomes (100 μg of protein) were incubated with the photoreactive LCFA probe for 2 h at 4 °C. After UV irradiation at 360 nm for 0–30 min at 0 °C, labeled proteins were separated on a 7–15% SDS-polyacrylamide gradient gel, and detected by streptavidin-HRP. The arrowhead indicates the 80-kDa protein labeled by the photoaffinity probe. Asterisks indicate nonspecific bands.
FIGURE 3.
FIGURE 3.
Photoaffinity labeling of rat liver peroxisomes in the presence of palmitoyl-CoA, palmitic acid, and CoA. Purified rat liver peroxisomes were photoaffinity labeled in the presence of increasing amounts of palmitoyl-CoA (A), palmitic acid (B), and CoA (C), respectively. After UV irradiation, labeled proteins were separated on a 7–15% SDS-polyacrylamide gradient gel, and detected by streptavidin-HRP (upper panels). Western blot analysis for PMP70 is used as a loading control (lower panels). The arrowheads and asterisks indicate the 80-kDa protein and the 65-kDa protein labeled by the photoaffinity probe, respectively.
FIGURE 4.
FIGURE 4.
Purification of the photolabeled 80-kDa protein. Purified rat liver peroxisomes (1 mg of protein) were labeled by the photoreactive LCFA probe. After solubilization with 0.1% Triton X-100, labeled proteins were purified by SoftLink Soft Release Avidin Resin. Purified proteins were separated on a 5–10% SDS-polyacrylamide gradient gel, and stained with silver staining. The arrowhead and asterisk indicates the 80- and 65-kDa proteins labeled by the photoaffinity probe, respectively.
FIGURE 5.
FIGURE 5.
Photoaffinity labeling of purified MFE2-His. Purified MFE2-His and His-Pex19p (A) were incubated with the photoreactive LCFA probe for 2 h at 4 °C. After UV irradiation at 360 nm for 30 min at 0 °C, labeled proteins were separated on a 7–15% SDS-polyacrylamide gradient gel, and detected by streptavidin-HRP (B). The asterisk indicates nonspecific bands.
FIGURE 6.
FIGURE 6.
Identification of the substrate-binding site of MFE2. Purified MFE2-His (100 μg of protein) was incubated with the photoreactive LCFA probe. The probe-incorporated MFE2-His was isolated by avidin resin followed by trypsin digestion. The resulting tryptic peptide mixture was analyzed by MALDI-TOF mass spectrometry (lower panel). As a control, unlabeled MFE2-His was similarly digested with trypsin and the resulting tryptic peptide mixture was subjected onto MALDI-TOF mass spectrometry (upper panel). The diagonal line indicates the mass difference between the peak in control sample corresponding to unmodified MFE2-peptide (amino acids 249–251) and the peak corresponding to an adduct of the MFE2-peptide (amino acids 249–251) with the LCFA probe in the sample treated with the probe.
FIGURE 7.
FIGURE 7.
Photoaffinity labeling of mutant MFE2-His. A, comparison of the purities of mutant MFE2-His (10 μg of protein). B, wild type and mutant MFE2-His (3.9 μg of protein) were labeled by the photoreactive LCFA probe. The labeled proteins were separated on a 7–15% SDS-polyacrylamide gradient gel, and detected by streptavidin-HRP. C, the amount of probe-incorporated MFE2s shown in B was quantified with a LAS4000 luminoanalyzer (Fuji Film, Tokyo, Japan) and the relative labeling percentage was expressed as a ratio of the labeling percentage of each mutant MFE2 with that of wild type MFE2.
FIGURE 8.
FIGURE 8.
Three-dimensional structure of MFE2 HD domain. A, binary structure of rat MFE2HD (Protein Data Bank code 1GZ6). The structure consists of two identical monomers colored blue and cyan, respectively. The catalytic residue (Tyr164) is colored yellow, and the probe-incorporated fragment (Trp249-Arg251) is colored red. The bound NAD+ are shown as a stick model and colored gray. B, zoom-in view of the molecular surface of the putative substrate binding cavity. The catalytic residue (Y164) and the probe-incorporated fragment (W249-R251) are colored as described in A. Aromatic residue (Y156) and hydrophobic residues (I160, I288) forming the hydrophobic cavity are colored magenta. Images were generated using PyMOL.
FIGURE 9.
FIGURE 9.
Photoaffinity labeling of mutant MFE2-His. Wild type and mutant MFE2-His (3.9 μg of protein) were photoaffinity labeled by the photoaffinity LCFA probe. The amount of probe-incorporated MFE2s was quantified with a LAS4000 luminoanalyzer and the relative labeling percentage was expressed as a ratio of the labeling percentage of each mutant MFE2 with that of wild type MFE2.

Similar articles

Cited by

References

    1. Wanders R. J., Waterham H. R. (2006) Annu. Rev. Biochem. 75, 295–332 - PubMed
    1. Lazarow P. B., Moser H. W. (1995) The Metabolic and Molecular Basis of Inherited Disease, pp. 2287–2324, McGraw-Hill Inc., New York
    1. Brosius U., Gärtner J. (2002) Cell. Mol. Life Sci. 59, 1058–1069 - PMC - PubMed
    1. Fujiki Y. (2000) FEBS Lett. 476, 42–46 - PubMed
    1. Wanders R. J., Waterham H. R. (2006) Biochim. Biophys. Acta 1763, 1707–1720 - PubMed

Publication types

MeSH terms

LinkOut - more resources