. 2010 Sep 3;285(36):27785-97.
doi: 10.1074/jbc.M110.112326. Epub 2010 Jun 21.

Predicting cardiomyopathic phenotypes by altering Ca2+ affinity of cardiac troponin C

Affiliations

Predicting cardiomyopathic phenotypes by altering Ca2+ affinity of cardiac troponin C

Michelle S Parvatiyar et al. J Biol Chem. .

Abstract

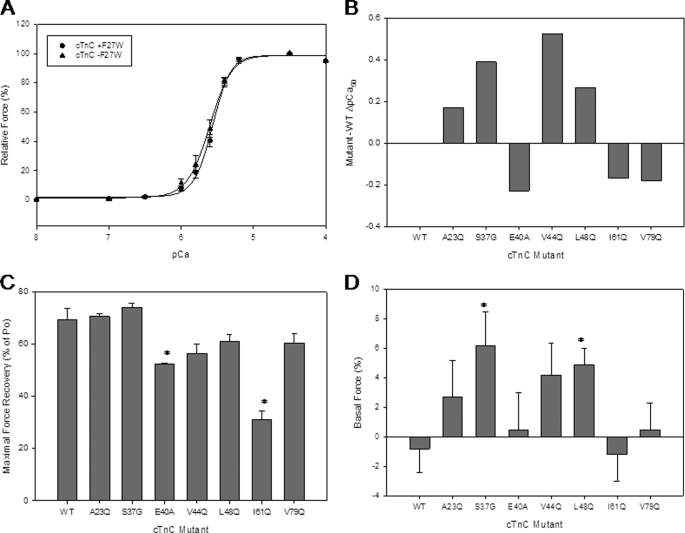
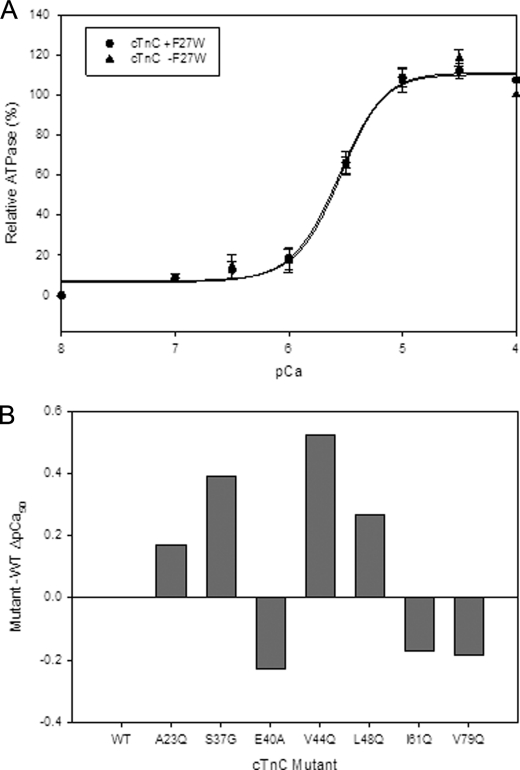
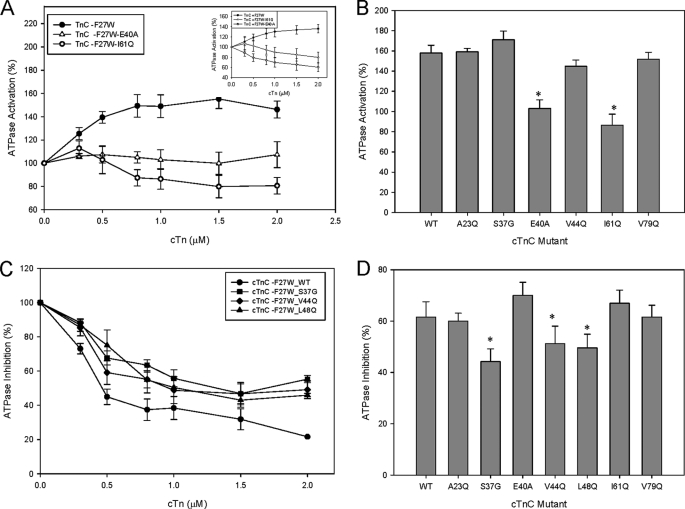
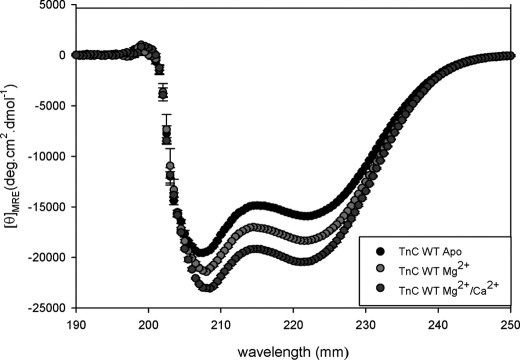
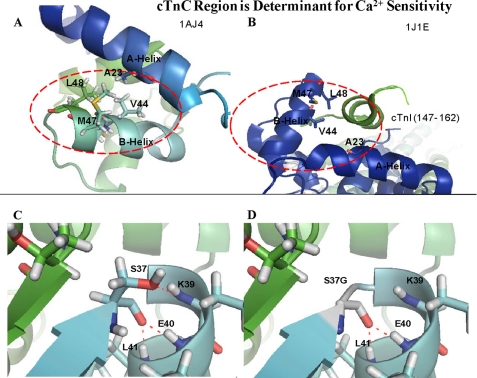
Cardiac diseases associated with mutations in troponin subunits include hypertrophic cardiomyopathy (HCM), dilated cardiomyopathy (DCM), and restrictive cardiomyopathy (RCM). Altered calcium handling in these diseases is evidenced by changes in the Ca(2+) sensitivity of contraction. Mutations in the Ca(2+) sensor, troponin C (TnC), were generated to increase/decrease the Ca(2+) sensitivity of cardiac skinned fibers to create the characteristic effects of DCM, HCM, and RCM. We also used a reconstituted assay to determine the mutation effects on ATPase activation and inhibition. One mutant (A23Q) was found with HCM-like properties (increased Ca(2+) sensitivity of force and normal levels of ATPase inhibition). Three mutants (S37G, V44Q, and L48Q) were identified with RCM-like properties (a large increase in Ca(2+) sensitivity, partial loss of ATPase inhibition, and increased basal force). Two mutations were identified (E40A and I61Q) with DCM properties (decreased Ca(2+) sensitivity, maximal force recovery, and activation of the ATPase at high [Ca(2+)]). Steady-state fluorescence was utilized to assess Ca(2+) affinity in isolated cardiac (c)TnCs containing F27W and did not necessarily mirror the fiber Ca(2+) sensitivity. Circular dichroism of mutant cTnCs revealed a trend where increased alpha-helical content correlated with increased Ca(2+) sensitivity in skinned fibers and vice versa. The main findings from this study were as follows: 1) cTnC mutants demonstrated distinct functional phenotypes reminiscent of bona fide HCM, RCM, and DCM mutations; 2) a region in cTnC associated with increased Ca(2+) sensitivity in skinned fibers was identified; and 3) the F27W reporter mutation affected Ca(2+) sensitivity, maximal force, and ATPase activation of some mutants.


Figures

FIGURE 1.
FIGURE 1.
Ca2+ dependence of force development in porcine skinned fibers reconstituted with the cTnC mutants. A, comparison of skinned fiber results obtained by reconstitution of skinned fibers with cTnC (−F27W) versus cTnC (+F27W). The fibers were depleted of endogenous cTnC by CDTA treatment and reconstituted with mutant mouse cTnCs. B, skinned fiber ΔpCa50 (Mutant pCa50−WT pCa50) from cTnC mutants (−F27W). Data graphed where endogenous pCa50 is utilized as a control from which the experimental pCa50 is subtracted. Data are shown where WT = 0. C, maximal force recovery for cTnC mutants (−F27W) reconstituted in skinned fibers. The % force recovered values are a comparison of the amount of force produced in endogenous pCa curves, and the value was obtained by the experimental pCa curves. D, basal force data are shown for cTnC mutants (−F27W) and plotted as % of increased base line after cTnC reconstitution. The basal force was calculated by dividing the increased base line by the maximal force recovery (see supplemental Fig. 1A). Each point represents an average number of experiments performed and is expressed as mean ± S.E. *, p < 0.05 compared with wild type.
FIGURE 2.
FIGURE 2.
Effect of the cTnC mutants on the Ca2+ dependence of actomyosin ATPase activity. A shows the Ca2+ sensitivity (pCa50) of the ATPase obtained using 1 μm cTn complex containing WT cTnC (+F27W) versus WT cTnC (−F27W). B, comparison of the ΔpCa50 values obtained from complexes containing cTnC mutants (−F27W). Data represent n = 4–8 and are reported as S.E. and shown in Table 1.
FIGURE 3.
FIGURE 3.
Effect of the cTnC mutants on activation and inhibition of the actomyosin-ATPase. A, comparison of the ATPase activation values with increasing concentrations of cTn complexes containing WT and DCM-like mutants E40A and I61Q cTnC (−F27W) at pCa 4.0. The inset shows ATPase activation of WT (+F27W) and the DCM-like mutants E40A and I61Q in the (+F27W) background. B, comparison of the relative ATPase activation levels for cTnC (−F27W) WT and mutants. C, inhibition of ATPase activity by increasing concentrations of cTn complexes containing mutant and WT cTnC (−F27W) was assessed at pCa 8.5. D, comparison of the relative ATPase inhibition levels for cTnC (−F27W) WT and mutants. The values were obtained from an average of 4–5 experiments performed in triplicate. Each point represents an average number of experiments performed and is expressed as mean ± S.E. *, p < 0.05 compared with wild type.
FIGURE 4.
FIGURE 4.
Determination of secondary structural characteristics of WT-cTnC by CD in various cation-bound states. The spectra compares the changes in α-helical content of WT-cTnC (−F27W) under different conditions as follows: apo, Mg2+-bound, Mg2+/Ca2+-bound states. Far-UV CD was recorded at 195–250 nm with a bandwidth of 1 nm at a speed of 50 nm/min and a resolution of 0.5 nm at room temperature (20 °C). Mean residue ellipticity ([θ]MRE, in degree·cm2/dmol) for the spectra was calculated utilizing the same Jasco system software and the following equation: [θ]MRE = [θ]/(10 × Cr × l), where [θ] is the measured ellipticity in millidegrees; Cr is the mean residue molar concentration, and l is the path length in centimeters.
FIGURE 5.
FIGURE 5.
Hot spot region in cTnC for increased Ca2+ sensitivity of force development. A, region in cTnC in the absence of TnI binding PDB 1AJ4. B, region is pictured in the presence of the TnI regulatory domain from PDB 1J1E. Modeling of the Ser-37 (C) and the S37G mutation (D) in the PDB file 1AJ4. Potential hydrogen bonds are shown as dotted red lines.

Similar articles

Cited by

References

    1. Kurebayashi N., Ogawa Y. (1988) J. Physiol. 403, 407–424 - PMC - PubMed
    1. Pollesello P., Ovaska M., Kaivola J., Tilgmann C., Lundström K., Kalkkinen N., Ulmanen I., Nissinen E., Taskinen J. (1994) J. Biol. Chem. 269, 28584–28590 - PubMed
    1. Sorsa T., Heikkinen S., Abbott M. B., Abusamhadneh E., Laakso T., Tilgmann C., Serimaa R., Annila A., Rosevear P. R., Drakenberg T., Pollesello P., Kilpelainen I. (2001) J. Biol. Chem. 276, 9337–9343 - PubMed
    1. el-Saleh S. C., Solaro R. J. (1987) J. Biol. Chem. 262, 17240–17246 - PubMed
    1. Chandra M., Rundell V. L., Tardiff J. C., Leinwand L. A., De Tombe P. P., Solaro R. J. (2001) Am. J. Physiol. Heart Circ. Physiol. 280, H705–H713 - PubMed

Publication types

MeSH terms