. 2010 Aug;16(8):1540-58.
doi: 10.1261/rna.1967910. Epub 2010 Jun 21.

Small RNA profiling reveals antisense transcription throughout the KSHV genome and novel small RNAs

Affiliations

Small RNA profiling reveals antisense transcription throughout the KSHV genome and novel small RNAs

Yao-Tang Lin et al. RNA. 2010 Aug.

Abstract

Kaposi's sarcoma-associated herpesvirus (KSHV) is a human tumor virus that encodes 12 precursor microRNAs (pre-miRNAs) that give rise to 17 different known approximately 22-nucleotide (nt) effector miRNAs. Like all herpesviruses, KSHV has two modes of infection: (1) a latent mode whereby only a subset of viral genes are expressed and (2) a lytic mode during which the full remaining viral genes are expressed. To date, KSHV miRNAs have been mostly identified via analysis of cells that are undergoing latent infection. Here, we developed a method to profile small RNAs ( approximately 18-75 nt) from populations of cells undergoing predominantly lytic infection. Using two different next-generation sequencing platforms, we cloned and sequenced both pre-miRNAs and derivative miRNAs. Our analysis shows that the vast majority of viral and host 5p miRNAs are co-terminal with the 5' end of the cloned pre-miRNAs, consistent with both being defined by microprocessor cleavage. We report the complete repertoire (25 total) of 5p and 3p derivative miRNAs from all 12 previously described KSHV pre-miRNAs. Two KSHV pre-miRNAs, pre-miR-K12-8 and pre-miR-K12-12, encode abundant derivative miRNAs from the previously unreported strands of the pre-miRNA. We identify several novel small RNAs of low abundance, including viral miRNA-offset-RNAs (moRNAs), and antisense viral miRNAs (miRNA-AS) that are encoded antisense to previously reported KSHV pre-miRNAs. Finally, we observe widespread antisense transcription relative to known coding sequences during lytic replication. Despite the enormous potential to form double-stranded RNA in KSHV-infected cells, we observe no evidence for the existence of abundant viral-derived small interfering RNAs (siRNAs).


Figures

FIGURE 1.
FIGURE 1.
Experimental strategy employed. (A) Two different sizes of small RNAs, 18–25 nt, enriched for miRNAs, and 45–75 nt, enriched for pre-miRNAs, were size-fractionated by denaturing polyacrylamide gel electrophoresis, ligated to linkers, and then converted to cDNA. After amplification, the cDNAs were sequenced by ABI SOLiD. Computational methods were used to map reads corresponding to the KSHV genome (NC_009333.1), and (B) the desired size class (19–23 nt) was plotted over other sizes present in the library to determine regions of the genome enriched for specific classes of small RNAs (hypothetical plot shown). (C) Western immunoblot analysis demonstrating induction of markers for lytic replication with various drug regimens for 48 h. The TREx–RTA BCBL-1 cells are highly inducible for initiation of lytic replication upon treatment with TPA, Ionomycin (ION), and Doxycyclin (DOX) (T.I.D., treatment with all three drugs). KapB, RTA, and K8.1 correspond to KSHV proteins that are known to be induced during lytic replication. (Control) Loading control, a >80-kDa band that cross-reacts with the anti-K8.1 antibody. (D) Northern blot analysis shows that the Polyadenylated Noncoding RNA (PAN), a lytic-specific transcript, is robustly induced when treated with triple drug regimen (T.I.D.) for 48 h. (E) Flow cytometric analysis shows the percent of individual cells expressing RTA or the late lytic protein K8.1. The dark line indicates cells treated with the triple drug regimen, T.I.D.
FIGURE 2.
FIGURE 2.
Plotting the ratio of 19–23-nt RNAs over other size classes mapping to the KSHV genome identifies regions enriched for small RNAs of interest. (A) Uninduced. (B) Induced. (C) Uninduced, 100× zoom on y-axis. (D) Induced, 100× zoom on y-axis. RNA libraries from the uninduced (A,C) or lytic-induced (B,D) RNA were analyzed. (A,B) Low-resolution view demonstrates the extreme enrichment of reads mapping to the KSHV pre-miRNA loci (labeled “f”). (C,D) Zooming in reveals additional regions enriched for 19–23-nt RNAs (a–e, g). Window analysis of reads that mapped to the KSHV genome was plotted using a window length of 500 nt (W = 500; see Materials and Methods section for more details). Regions with a greater number of short reads than long reads marked “a–f” were selected for further analysis. Arrows at the side of plots indicate the orientation of reads that are plotted (rightward arrows indicate top strand transcripts, leftward-facing arrows indicate the bottom strand transcripts).
FIGURE 3.
FIGURE 3.
Read coverage of four exemplary KSHV miRNAs and pre-miRNAs. Reads were mapped to a position on the miRBase-annotated hairpins. Note: The miRBase-annotated hairpins are longer than the actual pre-miRNA hairpins that are “liberated” by microprocessor cleavage. Pre-miRs-K12-8 and 12 both express abundant 5p and 3p derivative miRNAs that were missed in previous studies. Pre-miRs-K12-5, 10a, and 12 have flanking moRNAs. The “x” axis indicates the nucleotide position relative to the predicted longer hairpin precursor that is listed in miRBase. The “y” axis indicates the quantity of reads for a particular pre-miRNA derivative and is plotted on a log scale to show lower-abundance derivatives. The horizontal lines (green, red, blue, black) indicate the nucleotide position coverage of a particular read. The four vertical lines denote the start site and end site of the 5p and 3p miRNAs. (SU) The “small” RNA library (19–24 nt) from uninduced cells; (SI) the “small” RNA library from cells induced to initiate lytic replication; (LU) the “large” RNA library (45–75 nt) from uninduced cells; (LI) the “large” RNA library from cells induced to initiate lytic replication. The reads corresponding to the pre-miRNAs (LU, LI) have a maximum length of 35 nt (the upper cut-off of read length available from the current SOLiD platform). Reads corresponding to moRNAs are indicated with text above the relevant horizontal lines.
FIGURE 4.
FIGURE 4.
Northern blot analysis of KSHV-encoded miRNAs demonstrates that the 5p and 3p miRNAs are detectable from most KSHV pre-miRNA loci. For a few pre-miRNAs, only one strand was detectable as an miRNA (pre-miR-K12-1, 2, 4, and 6). For the others, the miRNAs were abundant enough that we could detect both the 5p and 3p derivatives. The left lanes (U) correspond to RNA from untreated cells (predominantly latent), the right lanes (I) correspond to RNA from induced cells enriched for lytic replication. Arrows indicate miRNAs migrating at ∼22 nt. The loading control, shown in bottom panels, is ethidium bromide-stained low-molecular-weight RNA.
FIGURE 5.
FIGURE 5.
Multiple specific small RNAs derived from pre-miR-K12. (A) Predicted secondary structure of pre-miR-K12-12. The two derivative miRNAs, K12-12-5p (Griffiths-Jones 2006) and K12-12-3p (reported in this study), are indicated with black bars. The K12-12 moRNA is indicated with a gray bar. (B) Northern blot analysis of miR-K12-12 5p and miR-K12-12-3p. Two models of lytic induction were analyzed. RNA from regular BCBL-1 cells that were predominantly undergoing latent infection (untreated) or treated with sodium butyrate (NaB) to induce lytic replication was used. RNA from the nonisogenic, uninfected KSHV-negative BJAB cells serves as a negative control. Additionally, RNA from untreated, predominantly latent, or triple drug-treated T.I.D. (lytic-enriched) TREx-RTA BCBL-1 cells was analyzed. Arrows indicate miRNA band. (C) Luciferase assay demonstrates that both miRNA derivatives of pre-miR-K12-12 are active. Renilla luciferase reporter vector with four copies of miR-K12-12-5p or miR-K12-12-3p target sites were co-transfected with the pre-miR-K12-4 or pre-miR-K12-12 expression vectors. As a negative control, an identical reporter containing mutations in the seed complementary region was also analyzed. A normalization vector (firefly luciferase vector) was also co-transfected as a control for transfection efficiency. (D) Histogram of read coverage from the small induced (18–25, SI) library shows the relative abundance of miR-K12-12-5p, miR-K12-12-3p, and K-12 moRNA. 3p derivative miRNAs correspond to the left peak; 5p derivative miRNAs correspond to right peak. A histogram of reads mapping to pre-miR-K12-3 is shown for comparison.
FIGURE 6.
FIGURE 6.
Expression and activity of an antisense miRNA complementary to the pre-miR-K12-4 locus. (A) Predicted secondary structure of the pre-miR-K12-4 and pre-miR-K12-4-AS. Mapped 5p derivative miRNAs are indicated with a black bar; mapped 3p derivative miRNAs are indicated with a gray bar. (B) Sequences of miR-K12-4 and miR-K12-4-AS. Nucleotide differences between K12-4-3p and K12-4-AS-3p are indicated in bold/underline. (C) Northern blot analysis of miR-K12-4-AS. Cells were transfected with a vector expressing either miR-K12-10 or miR-K12-4-AS. RNA was harvested and hybridized with a probe complementary to miR-K12-4-AS. Arrow indicates miRNA band. (D) miR-K12-4-AS is active within the RISC complex. Expression of a plasmid expressing miR-K12-4-AS down-regulates expression of a reporter containing complementary binding sites, but not a control reporter in which the seed complementary region is mutated.
FIGURE 7.
FIGURE 7.
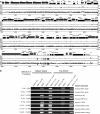
Antisense transcription is detected throughout the KSHV genome. (A) Coverage plot of all reads mapping to the KSHV genome. Sequenced frequency of reads that mapped to the KSHV genome for the combined short and long fractions of uninduced and induced samples is plotted on a log10 scale on the “y” axis. The “x” axis shows KSHV genomic position. Each graph is divided into top strand transcripts (top, rightward arrow) and bottom strand transcripts (bottom, leftward arrow) as indicated on the right side of the figure. Locations of confirmatory directional RT-PCR products are indicated with a small bar/line below the genome map (positions 5041–5252; 12,283–12,496; 25,831–26,039; 73,712–73,929; 87,182–87,451; 104,671–104,880; 121,579–121,820; 123,061–123,269). Genome annotations are based on NCBI reference sequence NC_009333.1. (B) Directional RT-PCR confirms existence of previously unreported antisense transcription during KSHV lytic infection. A positive control known to have antisense transcription (ORF50; 73,712–73,929) or seven regions previously only known to have transcription in one orientation were tested for antisense transcription. RNA from uninfected BJAB cells was used as a negative control. The orientation of the strand being primed by the RT primer is indicated at the top of the figure. A “no RT” control was included to exclude the possibility of genomic DNA contamination. To control for possible false positives due to RT mis-priming, all regions shown scored negative in PCR assays when any of 10 different control RT primers were used (Supplemental Fig. S6).

Similar articles

Cited by

References

    1. Applied Biosystems 2009. Whole-genome discovery and profiling of small RNAs using the SOLiD System. BioTechniques 46: 232–234
    1. Areste C, Blackbourn DJ 2009. Modulation of the immune system by Kaposi's sarcoma-associated herpesvirus. Trends Microbiol 17: 119–129 - PubMed
    1. Arias C, Walsh D, Harbell J, Wilson AC, Mohr I 2009. Activation of host translational control pathways by a viral developmental switch. PLoS Pathog 5: e1000334 doi: 10.1371/journal.ppat.1000334 - PMC - PubMed
    1. Babiarz JE, Ruby JG, Wang Y, Bartel DP, Blelloch R 2008. Mouse ES cells express endogenous shRNAs, siRNAs, and other Microprocessor-independent, Dicer-dependent small RNAs. Genes Dev 22: 2773–2785 - PMC - PubMed
    1. Bartel DP 2004. MicroRNAs: Genomics, biogenesis, mechanism, and function. Cell 116: 281–297 - PubMed

Publication types