Historical and contemporary gene dispersal in wild carrot (Daucus carota ssp. carota) populations
- PMID: 20566679
- PMCID: PMC2908163
- DOI: 10.1093/aob/mcq108
Historical and contemporary gene dispersal in wild carrot (Daucus carota ssp. carota) populations
Abstract
Background and aims: Wild carrot is the ancestor of cultivated carrot and is the most important gene pool for carrot breeding. Transgenic carrot may be released into the environment in the future. The aim of the present study was to determine how far a gene can disperse in wild carrot populations, facilitating risk assessment and management of transgene introgression from cultivated to wild carrots and helping to design sampling strategies for germplasm collections.
Methods: Wild carrots were sampled from Meijendel and Alkmaar in The Netherlands and genotyped with 12 microsatellite markers. Spatial autocorrelation analyses were used to detect spatial genetic structures (SGSs). Historical gene dispersal estimates were based on an isolation by distance model. Mating system and contemporary pollen dispersal were estimated using 437 offspring of 20 mothers with different spatial distances and a correlated paternity analysis in the Meijendel population.
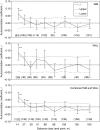
Key results: Significant SGSs are found in both populations and they are not significantly different from each other. Combined SGS analysis indicated significant positive genetic correlations up to 27 m. Historical gene dispersal sigma(g) and neighbourhood size N(b) were estimated to be 4-12 m [95 % confidence interval (CI): 3-25] and 42-73 plants (95 % CI: 28-322) in Meijendel and 10-31 m (95 % CI: 7-infinity) and 57-198 plants (95 % CI: 28-infinity) in Alkmaar with longer gene dispersal in lower density populations. Contemporary pollen dispersal follows a fat-tailed exponential-power distribution, implying pollen of wild carrots could be dispersed by insects over long distance. The estimated outcrossing rate was 96 %.
Conclusions: SGSs in wild carrots may be the result of high outcrossing, restricted seed dispersal and long-distance pollen dispersal. High outcrossing and long-distance pollen dispersal suggest high frequency of transgene flow might occur from cultivated to wild carrots and that they could easily spread within and between populations.
Figures


Similar articles
-
Dissimilarity of contemporary and historical gene flow in a wild carrot (Daucus carota) metapopulation under contrasting levels of human disturbance: implications for risk assessment and management of transgene introgression.Ann Bot. 2013 Nov;112(7):1361-70. doi: 10.1093/aob/mct208. Epub 2013 Sep 19. Ann Bot. 2013. PMID: 24052560 Free PMC article.
-
Pollen-mediated gene flow from wild carrots (Daucus carota L. subsp. carota) affects the production of commercial carrot seeds (Daucus carota L. subsp. sativus) internationally and in New Zealand in the context of climate change: A systematic review.Sci Total Environ. 2024 Jul 10;933:173269. doi: 10.1016/j.scitotenv.2024.173269. Epub 2024 May 14. Sci Total Environ. 2024. PMID: 38754518
-
Genetic structure and domestication of carrot (Daucus carota subsp. sativus) (Apiaceae).Am J Bot. 2013 May;100(5):930-8. doi: 10.3732/ajb.1300055. Epub 2013 Apr 17. Am J Bot. 2013. PMID: 23594914
-
New insights into domestication of carrot from root transcriptome analyses.BMC Genomics. 2014 Oct 14;15(1):895. doi: 10.1186/1471-2164-15-895. BMC Genomics. 2014. PMID: 25311557 Free PMC article.
-
The Wild Carrot (Daucus carota): A Phytochemical and Pharmacological Review.Plants (Basel). 2023 Dec 27;13(1):93. doi: 10.3390/plants13010093. Plants (Basel). 2023. PMID: 38202401 Free PMC article. Review.
Cited by
-
Mapping genes governing flower architecture and pollen development in a double mutant population of carrot.Front Plant Sci. 2014 Oct 8;5:504. doi: 10.3389/fpls.2014.00504. eCollection 2014. Front Plant Sci. 2014. PMID: 25339960 Free PMC article.
-
Synergistic effects produced by certain antioxidants in valuable functional foods from the Romanian markets.Front Nutr. 2025 Jun 19;12:1558597. doi: 10.3389/fnut.2025.1558597. eCollection 2025. Front Nutr. 2025. PMID: 40612300 Free PMC article.
-
Miniature Inverted Repeat Transposable Element Insertions Provide a Source of Intron Length Polymorphism Markers in the Carrot (Daucus carota L.).Front Plant Sci. 2017 May 9;8:725. doi: 10.3389/fpls.2017.00725. eCollection 2017. Front Plant Sci. 2017. PMID: 28536590 Free PMC article.
-
Insights into genetic diversity and population structure of Indian carrot (Daucus carota L.) accessions.J Appl Genet. 2020 Sep;61(3):303-312. doi: 10.1007/s13353-020-00556-6. Epub 2020 Apr 2. J Appl Genet. 2020. PMID: 32240517
-
Linkage mapping of root shape traits in two carrot populations.G3 (Bethesda). 2024 Apr 3;14(4):jkae041. doi: 10.1093/g3journal/jkae041. G3 (Bethesda). 2024. PMID: 38412554 Free PMC article.
References
-
- Austerlitz F, Dick CW, Dutech C, et al. Using genetic markers to estimate the pollen dispersal curve. Molecular Ecology. 2004;13:937–954. - PubMed
-
- Boutin-Ganache I, Raposo M, Raymond M, Deschepper CF. M13-tailed primers improve the readability and usability of microsatellite analyses performed with two different allele-sizing methods. BioTechniques. 2001;31(24–26):28. - PubMed
-
- Chen WP, Punja ZK. Transgenic herbicide- and disease-tolerant carrot (Daucus carota L.) plants obtained through Agrobacterium-mediated transformation. Plant Cell Reports. 2002;20:929–935.
-
- Ellstrand NC, Prentice HC, Hancock JF. Gene flow and introgression from domesticated plants into their wild relatives. Annual Review of Ecology and Systematics. 1999;30:539–563.

