. 2010 Sep 1;19(17):3413-29.
doi: 10.1093/hmg/ddq253. Epub 2010 Jun 21.

Antioxidants can inhibit basal autophagy and enhance neurodegeneration in models of polyglutamine disease

Affiliations

Antioxidants can inhibit basal autophagy and enhance neurodegeneration in models of polyglutamine disease

Benjamin R Underwood et al. Hum Mol Genet. .

Abstract

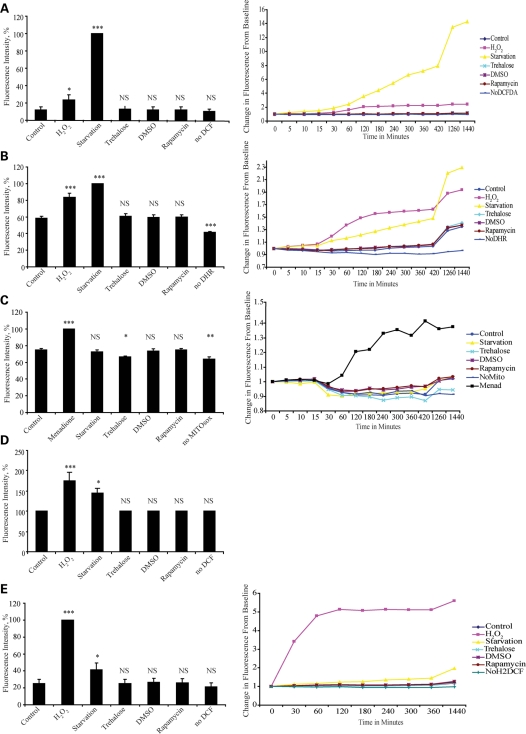
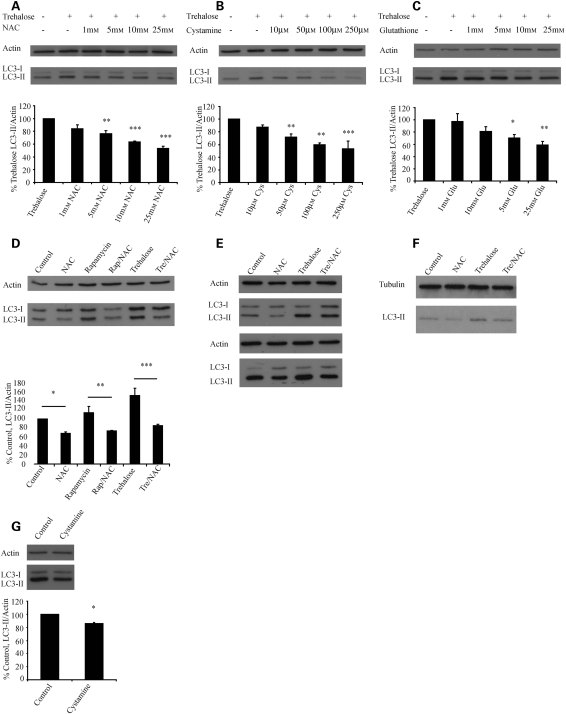
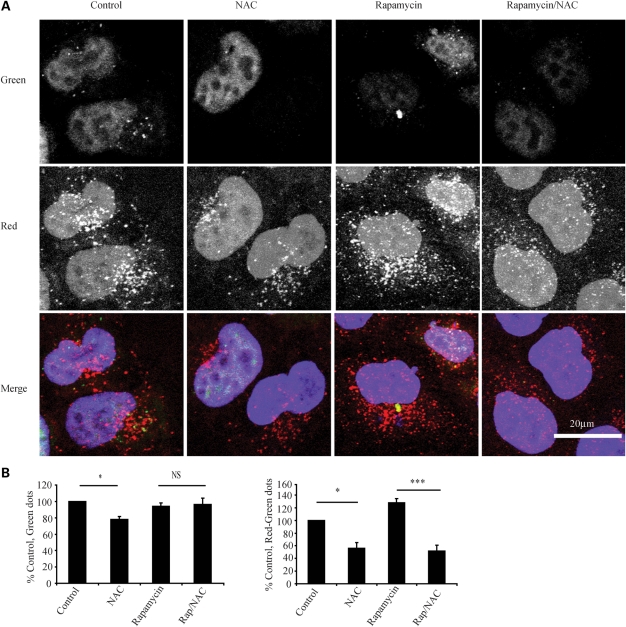
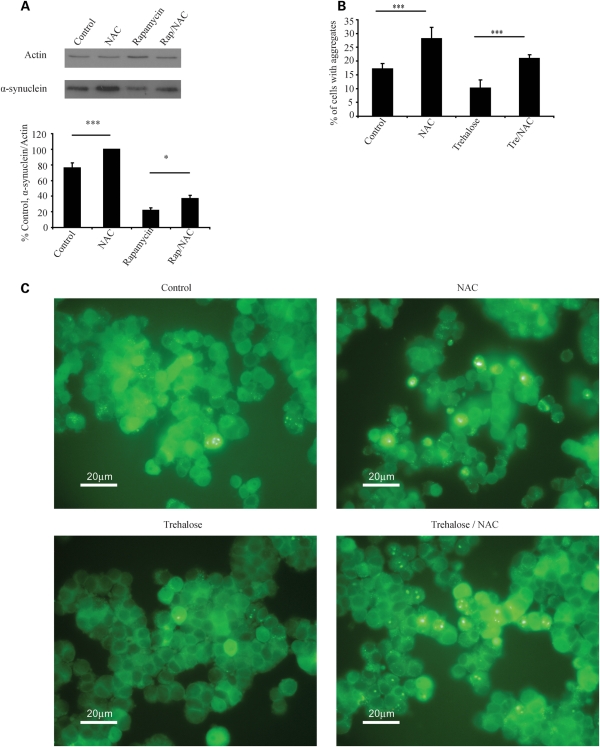
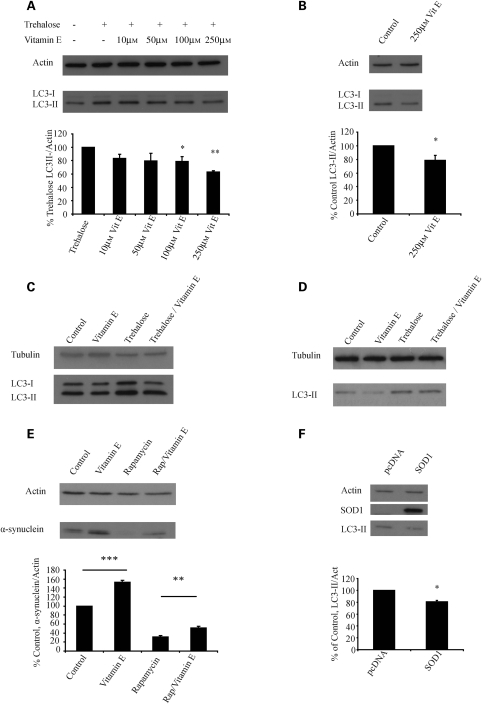
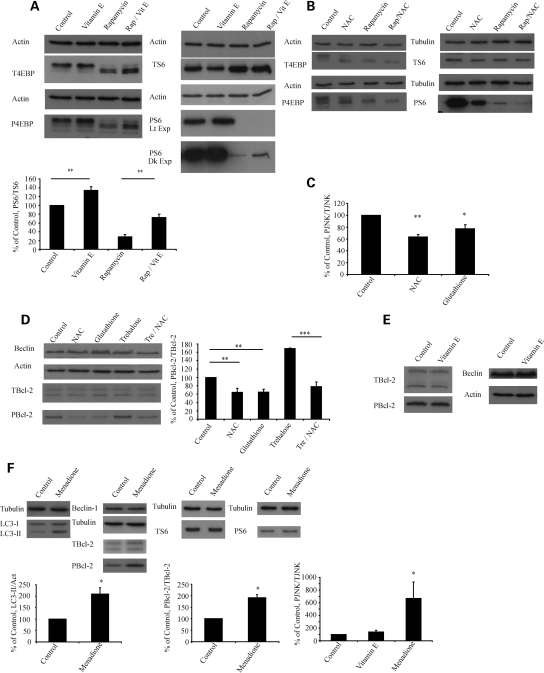
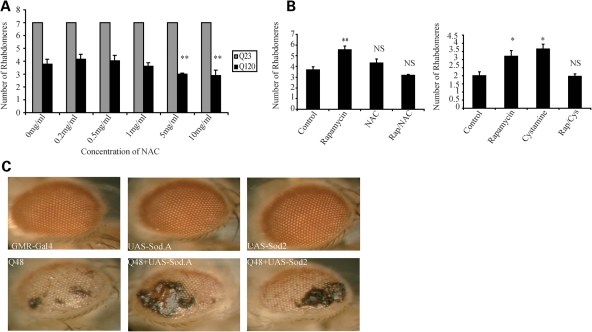
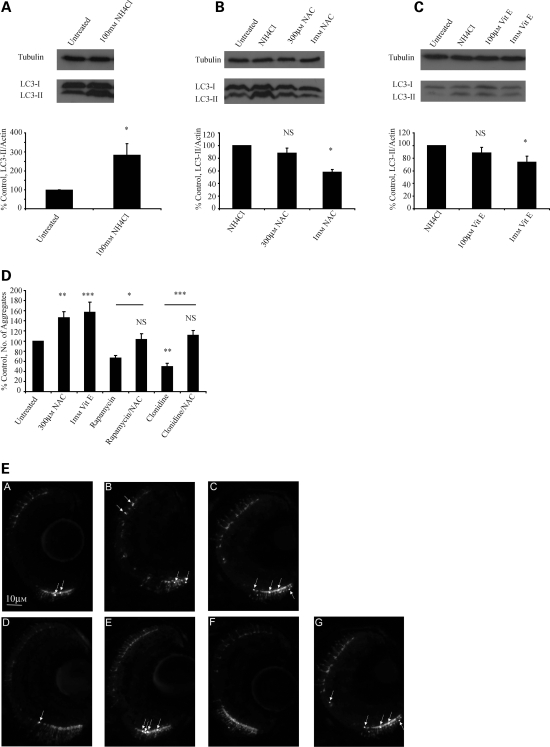
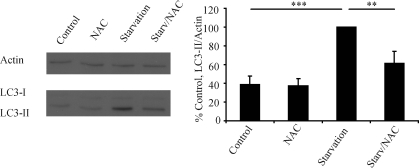
Many neurodegenerative diseases exhibit protein accumulation and increased oxidative stress. Therapeutic strategies include clearing aggregate-prone proteins by enhancing autophagy or decreasing oxidative stress with antioxidants. Many autophagy-inducing stimuli increase reactive oxygen species (ROS), raising concerns that the benefits of autophagy up-regulation may be counterbalanced by ROS toxicity. Here we show that not all autophagy inducers significantly increase ROS. However, many antioxidants inhibit both basal and induced autophagy. By blocking autophagy, antioxidant drugs can increase the levels of aggregate-prone proteins associated with neurodegenerative disease. In fly and zebrafish models of Huntington's disease, antioxidants exacerbate the disease phenotype and abrogate the rescue seen with autophagy-inducing agents. Thus, the potential benefits in neurodegenerative diseases of some classes of antioxidants may be compromised by their autophagy-blocking properties.


Figures

Figure 1.
Figure 1.
Not all autophagy-inducing agents cause an increase in ROS. Neither trehalose or rapamycin cause an increase in levels of ROS. HeLa cells were loaded with DCFDA (A), dihydrorhodamine 123 (B) or MitoSOX™ red (C), before being treated with H2O2, menadione, rapamycin, trehalose, DMSO or starved in Hanks Balanced Salt Solution (HBSS). Fluorescent signal was serially measured as described in Materials and Methods. The histograms show signal at 24 h as percentage of positive control while adjacent line graphs show change from baseline against time over 24 h. (D) Cells were treated with trehalose, dimethyl sulfoxide (DMSO), rapamycin or neither for 24 h before being loaded with DCFDA and signal read 1 h later. Treatment with hydrogen peroxide or starvation for 1 h after loading provided positive controls. Rapamycin and trehalose cause no increase in signal. (E) COS-7 cells were loaded with Carboxy-H2DCFDA before being treated in a similar way to (A). Only H2O2 and starvation caused significant increases in signal. All experiments were performed with no probe as a negative control (no DCFDA, NoDCFDA; no dihydrorhodamine, NoDHR; no Mito, No MitoSOX™ red; No Carboxy-H2DCFDA, NoH2DCF). Error bars are present for all data points (but are too small to be seen on some) and show standard error of the mean (SEM) for three independent experiments in triplicate (NS, not significant, *P < 0.05, **P < 0.01, ***P < 0.001).
Figure 2.
Figure 2.
Antioxidant drugs inhibit basal and induced autophagy. NAC, cystamine and glutathione all inhibit trehalose-induced autophagy. COS-7 cells were treated with trehalose and co-treated with the indicated concentrations of NAC (A), pre-treated for 24 h with cystamine (Cys) (B) or co-treated with glutathione (Glu) (C). After 24 h, a saturating dose of bafilomycin A1 was added for the last 4 h prior to harvest. The graphs below each blot show densitometric analysis of LC3-II/actin from three experiments performed in triplicate, with the control condition (trehalose alone) set to 100%. (D) NAC impairs rapamycin induced and basal autophagy. COS-7 cells were treated with 25 mm NAC, rapamycin, rapamycin and NAC, trehalose (Tre) or trehalose and NAC for 24 h. All conditions were treated with bafilomycin for 4 h prior to harvesting. The graph shows densitometric analysis with no treatment (control) set to 100%. (E) The effects of NAC on autophagy are also seen in neurons. Differentiated human primary cortical neurons were treated as indicated (NAC 10 mm) and blotted at 24 h with no further treatment (upper panel) or following 4 h of treatment with bafilomycin A1 (lower panel). Representative data from an experiment performed in triplicate is shown. (F) The effects of NAC are seen in HeLa cells. Hela cells were treated under control conditions or with NAC (15 mm), trehalose, or trehalose and NAC for 24 h before analysis by western blot. All experiments were carried out in the presence of a saturating dose of bafilomycin for the last 4 h. Note that HeLa cells have very low levels of LC3-1. (G) Cystamine can inhibit basal autophagy. COS-7 cells were treated with 250 µm cystamine for 48 h, the last 4 h also being in the presence of bafilomycin before being analysed by western blot. Error bars in all panels represent SEM from at least three independent experiments performed in triplicate (*P < 0.05, **P < 0.01, ***P < 0.001).
Figure 3.
Figure 3.
NAC impairs autophagosome synthesis in a second assay. (A) NAC significantly decreases both autophagosome and autophagolysosome number. HeLa cells expressing RFP and GFP tagged LC3-II as described in Materials and Methods were treated as shown (NAC 10 mm), before being fixed and subjected to automated counting of red and green dots. Representative confocal microscopy images are shown. (B) Results of automated cell counting. The left panel shows the number of green dots (autophagosomes) and the right panel the number of red minus green dots (autophagolysosomes) relative to control. The graphs shown represent the mean results from five experiments performed in triplicate. Error bars represent SEM (*P < 0.05, ***P < 0.001, NS, non significant).
Figure 4.
Figure 4.
NAC impairs clearance of autophagy substrates. (A) Expression of HA-tagged A53T α-synuclein [a mutant form of the protein that does not form visible aggregates in these cells (22)] was induced for 48 h before transgene expression was switched off. During the switch-off period, cells were treated as shown (NAC 10 mm, Rap, rapamycin) for 24 h before being harvested and analysed by western blotting. The graph shows densitometric analysis with results for NAC set to 100%. (B) NAC increases aggregation of mutant huntingtin. Expression of EGFP tagged huntingtin exon 1 with an expanded (74Q) polyglutamine repeat was induced for 8 h (47). The transgene was then switched off and the cells treated as shown (NAC 10 mm) for 72 h before fixing and counting. The graph shows percentage of cells with aggregates for each condition for a representative experiment, error bars represent standard deviation. For all other panels, error bars represent SEM (*P < 0.05, ***P < 0.001, NS, non significant).
Figure 5.
Figure 5.
Vitamin E and over-expression of SOD can also inhibit autophagy. (A) Vitamin E can inhibit trehalose-induced autophagy. COS-7 cells were treated with trehalose and increasing doses of vitamin E (DL-alpha tocopherol, VitE) for 24 h, before treatment for 4 h with bafilomycin, in a similar manner to the experiments presented in Figure 2A–C. The densitometric analysis shows error bars and statistics from three experiments performed in triplicate as in Figure 2A–C. (B) Vitamin E can inhibit basal autophagy. COS-7 cells were treated with 250 µm vitamin E before being analysed by western blot in a similar manner to Figure 2G. (C) The effects of vitamin E on autophagy are also seen in primary neuronal culture. Differentiated mouse primary cortical neurones were treated as indicated with bafilomycin added for the last 4 h. (D) Vitamin E has similar effects on basal and induced autophagy in HeLa cells. HeLa cells were treated under control conditions or with vitamin E (250 µm), trehalose or trehalose and vitamin E for 24 h before analysis by western blot. All experiments were carried out in the presence of a saturating dose of bafilomycin for the last 4 h. (E) Vitamin E can inhibit the clearance of autophagy substrates associated with neurodegenerative disease. Expression of HA-tagged A53T α-synuclein was induced for 48 h before the cells were treated as shown (vitamin E, 250 µm) for 24 h before being harvested and analysed by western blotting. The graph shows densitometric analysis with results for control set to 100%. (F) COS-7 cells were transfected with human SOD1 and allowed to express for 48 h, the last 4 h with bafilomycin. A representative western blot is shown. The graph shows densitometric analysis from five independent experiments performed in triplicate with pcDNA (control) set to 100%. Error bars represent SEM (*P < 0.05, **P < 0.01, ***P < 0.001, NS, non-significant) for all panels.
Figure 6.
Figure 6.
Antioxidants affect different canonical mechanisms regulating autophagy. (A) Vitamin E increases phosphorylation of mTOR substrates. COS-7 cells were treated with 250 µm vitamin E, rapamycin or rapamycin and vitamin E for 24 h before harvest. Lysates were run simultaneously on two gels and probed for mTOR substrates and loading controls. 4E-BP-1 (an mTOR substrate) has multiple phosphorylation sites and runs as four bands with the upper bands representing predominantly phosphorylated forms. Vitamin E increases phosphorylation compared with control and impairs the ability of rapamycin to inhibit the phosphorylation of 4E-BP1. These results were confirmed using a second substrate, ribosomal protein S6. T4E-BP denotes total 4E-BP, P4E-BP phosphorylated 4EBP, TS6 total S6 and PS6 phosphorylated S6. Dk exp denotes dark exposure and Lt exp light exposure. (B) NAC decreases phosphorylation of mTOR substrates. This experiment was performed in a similar manner to (A) but using 25 mm NAC instead of vitamin E. Representative western blots are shown. (C) Thiol antioxidants decrease JNK phosphorylation. COS-7 cells were treated for 24 h with 25 mm NAC or glutathione and the phosphorylation of JNK measured using a FACE ELISA kit. The graph shows phosphorylated (PJNK)/total JNK (TJNK) with control set to 100%. (D) Thiol antioxidants decrease Bcl-2 phosphorylation. COS-7 cells were treated as shown for 24 h and blotted for phosphorylated Bcl-2 (PBcl-2) before stripping and reprobing for total Bcl-2 (TBcl-2). The graph represents densitometric analysis. (E) Vitamin E has no effect on Bcl-2 phosphorylation. COS-7 cells were treated for 24 h with vitamin E or DMSO control and analysed by western blot for levels of phosphorylated Bcl-2 and Beclin 1. No significant differences were seen. (F) The superoxide generating agent menadione increases LC3-II and phosphorylation of JNK and Bcl-2, but has no effect on mTOR substrates or Beclin-1 expression. COS-7 cells were treated with 100 µm menadione for 1 h prior to harvest and analysed by western blot for LC3-II, phosphorylated Bcl-2 and total Bcl-2. The graphs show densitometric analysis with control set to 100%. The effect of menadione and vitamin E on JNK phosphorylation was analysed in a similar way to (C). All panels represent results from three independent triplicate experiments, error bars represent SEM (*P < 0.05, **P < 0.01, ***P < 0.001, NS, non-significant).
Figure 7.
Figure 7.
Thiol antioxidants and over-expression of SOD can enhance the phonotype in Drosophila models of polyglutamine disease. (A) High-dose NAC exacerbates mutant huntingtin phenotypes. Flies expressing mutant Q120 huntingtin exon-1 in the eye show an increase in neurodegeneration when treated with high dosage of NAC (5–10 mg/ml), while no such phenomena is seen in Q23 control flies. (B) The rescue in Q120 flies seen with rapamycin is abolished when rapamycin is combined with NAC or cystamine. Flies expressing mutant huntingtin exon-1 in eyes showed a significant decrease in neurodegeneration when treated with 100 µm cystamine or 2 µm rapamycin. Neurodegeneration was reversed to control level when the Q120 flies were treated with 500 mg/ml NAC or 100 µm cystamine combined with 2 µm rapamycin (*P < 0.05, **P < 0.01, NS, non-significant). (C) Over-expression of SOD can exacerbate neurodegeneration. Male flies expressing a naked polyglutamine tract (Q48) in the eye show a dramatic increase in neurodegeneration when crossed with flies over-expressing SOD1 or SOD2, while over-expression of SOD1 (Sod.A) or SOD2 has no such effect in control flies.
Figure 8.
Figure 8.
NAC and vitamin E can inhibit autophagic flux and increase aggregation in a zebrafish model of Huntington's disease. (A) Ammonium chloride causes significant increases in levels of LC3-II in zebrafish larvae, consistent with an ability to block autophagosome/lysosome fusion. (B and C) In zebrafish, co-treatment with either NAC or vitamin E significantly decreases the levels of LC3-II seen in the presence of ammonium chloride, consistent with their ability to decrease autophagic flux. The panels show western blots for LC3-II against tubulin loading controls. The graphs represent densitometric analysis of three independent experiments. (D and E) NAC and vitamin E increase aggregation, while the autophagy-inducing drugs rapamycin and clonidine decrease aggregation, of EGFP mutant huntingtin in the retina of transgenic zebrafish. (D) shows the average number of aggregates per retina in each condition relative to control. Representative images taken from the retina are shown in (E) with huntingtin aggregates indicated by arrows. (A, control condition; B, NAC treatment; C, vitamin E; D, rapamycin treatment; E, rapamycin and NAC; F, clonidine treatment; G, clonidine and NAC). Note that the rescue seen with rapamycin or clonidine is abolished by co-treatment with NAC (*P < 0.05, **P < 0.01, ***P < 0.001, NS, non-significant).
Figure 9.
Figure 9.
NAC inhibits the increase in hepatic LC3-II in starved mice. Mice underwent two periods of starvation of 24 h separated by 90 min of access to food. Following sacrifice, the liver was analysed by western blotting for levels of LC3-II. The graph represents the mean results from five mice per group with starvation (positive control, Starv) set to 100%. Error bars represent SEM (**P < 0.01, ***P < 0.001, NS, non significant).

Similar articles

Cited by

References

    1. Weintraub D., Comella C.L., Horn S. Parkinson's disease—Part 1: pathophysiology, symptoms, burden, diagnosis, and assessment. Am. J. Manag. Care. 2008;14:S40–S48. - PubMed
    1. Phillips W., Shannon K.M., Barker R.A. The current clinical management of Huntington's disease. Mov. Disord. 2008;23:1491–1504. doi:10.1002/mds.21971. - DOI - PubMed
    1. Stack E.C., Matson W.R., Ferrante R.J. Evidence of oxidant damage in Huntington's disease: translational strategies using antioxidants. Ann. N. Y. Acad. Sci. 2008;1147:79–92. - PubMed
    1. Kamat C.D., Gadal S., Mhatre M., Williamson K.S., Pye Q.N., Hensley K. Antioxidants in central nervous system diseases: preclinical promise and translational challenges. J. Alzheimers. Dis. 2008;15:473–493. - PMC - PubMed
    1. Berger Z., Ravikumar B., Menzies F.M., Oroz L.G., Underwood B.R., Pangalos M.N., Schmitt I., Wullner U., Evert B.O., O'Kane C.J., et al. Rapamycin alleviates toxicity of different aggregate-prone proteins. Hum. Mol. Genet. 2006;15:433–442. doi:10.1093/hmg/ddi458. - DOI - PubMed

Publication types