. 2010 Jul 5;207(7):1369-80.
doi: 10.1084/jem.20100285. Epub 2010 Jun 21.

ATM-deficient thymic lymphoma is associated with aberrant tcrd rearrangement and gene amplification

Affiliations

ATM-deficient thymic lymphoma is associated with aberrant tcrd rearrangement and gene amplification

Shan Zha et al. J Exp Med. .

Abstract

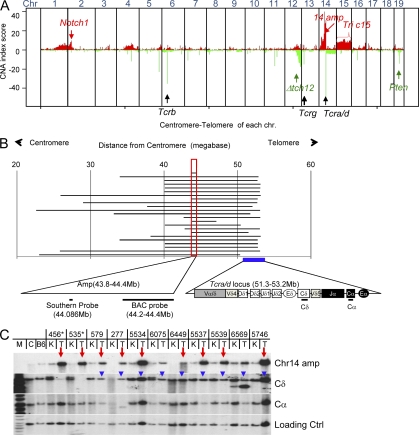
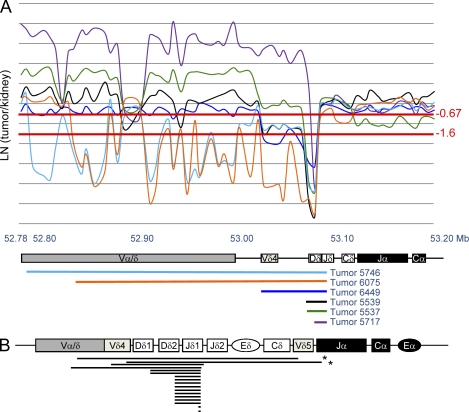
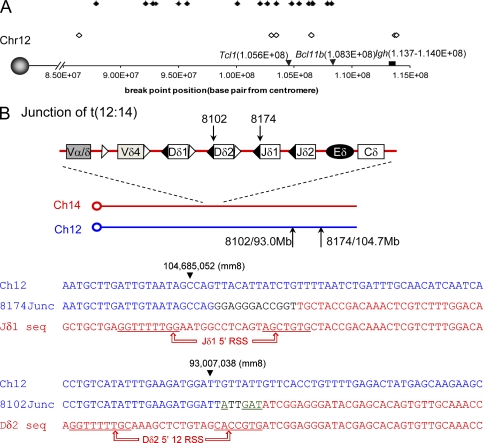
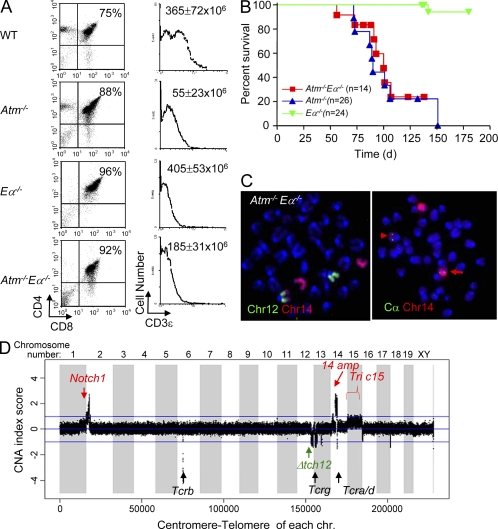
Ataxia telangiectasia mutated (ATM) deficiency predisposes humans and mice to T lineage lymphomas with recurrent chromosome 14 translocations involving the T cell receptor alpha/delta (Tcra/d) locus. Such translocations have been thought to result from aberrant repair of DNA double-strand breaks (DSBs) during Tcra locus V(D)J recombination, and to require the Tcra enhancer (Ealpha) for Tcra rearrangement or expression of the translocated oncogene. We now show that, in addition to the known chromosome 14 translocation, ATM-deficient mouse thymic lymphomas routinely contain a centromeric fragment of chromosome 14 that spans up to the 5' boundary of the Tcra/d locus, at which position a 500-kb or larger region centromeric to Tcra/d is routinely amplified. In addition, they routinely contain a large deletion of the telomeric end of one copy of chromosome 12. In contrast to prior expectations, the recurrent translocations and amplifications involve V(D)J recombination-initiated breaks in the Tcrd locus, as opposed to the Tcra locus, and arise independently of the Ealpha. Overall, our studies reveal previously unexpected mechanisms that contribute to the oncogenic transformation of ATM-deficient T lineage cells.


Figures

Figure 1.
Figure 1.
Amplification of sequences centromeric to the Tcra/d locus in Atm−/− T cell lymphomas. (A) Combined CGH analysis of 18 ATM-deficient thymic lymphomas. Each tumor sample was hybridized and analyzed once with matched kidney control DNA. The y axis represents amplification/deletion index (sum of LN tumor/kidney ratio of all tumors analyzed). Amplification and deletion were scored separately and plotted together. The amplification score at each probe location is plotted in red and deletion score is plotted in green. At some loci, such as the telomeric end of chromosome 12, both deletions and amplifications were found in this collection of tumors, which is termed copy number polymorphism, indicating inconsistent copy number changes in this region. The x axis depicts all 19 mouse chromosomes (1 to 19 arranged from centromere to telomere). The red arrows and text highlight recurrent amplifications of Notch1 and chromosome 14 sequences upstream of the Tcra/d locus, and as well as recurrent trisomy 15 (Tric15). The black arrows and text indicate the position of Tcr gene loci. The green arrows and text highlight recurrent deletions in the telomeric portion of chromosome 12 (Δtch12) and the Pten locus. (B) The diagram shows the length of amplification (defined by LN2 tumor/kidney > 0.667) in each of the ATM-deficient thymic lymphomas. The x axis is the base pair position indicated by distance (Mb) from the chromosome 14 centromere. The common amplification region is marked with a red box and shown in the expanded form at the bottom. The position of the BAC probe used for FISH (RP23_359O5) and probe used for Southern blotting are indicated. The Tcra/d locus is indicated with a filled blue box and expanded at the bottom of the panel to show relative orientation. (C) Southern blot analyses of 11 tumor/kidney DNA pairs. About 10 µg of genomic DNA from kidney (K) and the corresponding tumors (T) was digested with EcoRI and probed with the probe described in B (Chr14 Amp) and with probes that recognize the Tcrd constant region (Cδ) or the Tcra (Cα). The red arrows indicate tumor samples with significant amplification. The blue arrowheads indicate the retention of Cδ in those tumors. The asterisks mark the two samples that show Cδ deletion as predicted by CGH analysis (Fig. 3 B). The loading control probe was derived from an intron of the Mdc1 gene (which lies on mouse chromosome 17). M, DNA Marker; C, control DNA from 129sv mouse strain; B6, control DNA from BL6 mouse strain.
Figure 2.
Figure 2.
Cytogenetic analysis of ATM-deficient thymic lymphomas. (A) Relative position of the 5′Tcra/d (green), Cα (red), chr 14 Cen (green), and Amp (green) probes in relation to the Tcra/d locus on mouse chromosome 14. The colors of the lines indicating particular probes are consistent with the colors of these probes in C. (B) Representative chromosome 14 (red) and chromosome 12 (green) paint analysis of a metaphase from an ATM-deficient thymic lymphoma shows a t(12;14) translocation (white arrow), two other chromosome 14 or chromosome 14 fragments (red), and a chromosome 12 (green). Other representative analyses are shown in Fig. S4, and a summary of all slides analyzed is shown in Table S1. (C) Combined FISH and paint analyses of chromosomes 14 and 12 (and their derivatives) from ATM-deficient thymic lymphomas. The color dedication of each row is marked by the color of the font indicating the probes at the left. (top) One representative slide from tumor 5534 that was hybridized with chromosome paint, stripped and rehybridized with Cα and ch14cen FISH, and then stripped and rehybridized with Cα and Amp FISH. (middle) Another representative slide from tumor 5534, which was hybridized with chromosome paint, stripped, and hybridized with Cα and 5′Tcra/d probes. (bottom) Another representative slide from tumor 5534, which was first hybridized with chromosome paint, and then stripped and hybridized with Igh (199) FISH probe. Other representative analyses are shown in Fig. S4, and a summary of all slides analyzed is shown in Table S2. (D) Representative FISH analysis of using the Amp BAC (359O5 in green) and Cα BAC (in red) on metaphases from ATM-deficient thymic lymphomas. A white arrow indicates the amplified 359O5 signal and a yellow arrow indicates the isolated Cα. A pink arrow indicates the normal chromosome 14 containing both the Amp and Cα (without amplification) signals. Other representative analyses are shown in Fig. S4, and a summary of all slides analyzed is shown in Table S3. At least 10 (usually 20) independent metaphases were scored for each tumor shown in the representative examples shown in this figure. The figures show results that were found in least 50% (often >85%) of the metaphases scored from each slides.
Figure 3.
Figure 3.
ATM-deficient thymic lymphomas usually arise from cells that have not attempted Tcra rearrangement. (A) High-resolution CGH data of the Tcra/d of six representative ATM-deficient thymic lymphomas. Each tumor sample was hybridized and analyzed with matched kidney control DNA. The y axis is the Log2 (tumor/kidney) ratio. The x axis is the megabase position of each probe from the chromosome 14 centromere. The diagram at the bottom shows the relative position of the Tcra/d locus within this region. The homozygous deletion cut-off (Log2 [tumor/kidney] = −1.6) and heterozygous deletion cut-off (Log2 (tumor/kidney) = −0.67) are marked in red. Each tumor is represented by a unique color, and the relative size of their deletions within the analyzed region is schematically represented by a solid line of the same color below the Tcra/d map. (B) Schematic representation of homozygous deleted areas (defined by Log2[tumor/kidney] ratio < −1.6) within the Tcra/d locus for ATM-deficient thymic lymphomas. Each line represents the deleted region in one of the 20 independent tumors analyzed. The analysis includes the six tumor samples shown in A. The asterisks mark two tumors that deleted Cδ based on CGH (also shown in Fig. 1 C).
Figure 4.
Figure 4.
The t(12;14) translocations in Atm−/− thymic lymphomas have junctions within a broad telomeric region of chromosome 12. (A) CGH mapping of the centromeric boundary of hemizygous deletions at the telomeric end of chromosome 12 in Atm−/− thymic lymphomas. A hemizygous deletion is defined by Log2 (tumor/kidney) ratio below −0.6. The filled diamonds represent Atm−/− tumors and the open diamonds represent the −/−Atm−/− tumors. The x axis is marked with the base pair position from the centromere of chromosome 12 (according to mouse genome mm8). The positions of Tcl1, Bcl11b, and Igh are marked by black arrows or boxes. (B) Diagram and sequence of t(12:14) translocation junctions obtained from two Atm−/− thymic lymphomas (8102 and 8174). Both junctions were independently PCR amplified, cloned (in duplicate), and sequenced from both ends. The arrows on the diagram and arrowheads on the sequences indicate the position of the breakpoints in chromosomes 14 and 12. In the sequence diagrams, sequences corresponding to germ line chromosome 12 sequences are presented in blue and those corresponding to germ line Tcrd sequences (chromosome 14) are shown in red. The black letters in junction 8174 indicate nucleotides that could not be unequivocally matched to either side of the junction (e.g., potential insertions). The underlined, green letters in junction 8102 (GAT and A) are potential palindromic (P) elements. The canonical RSS sequences for the involved Jδ and Dδ segments are underlined.
Figure 5.
Figure 5.
Ea is not required for ATM-deficient thymic lymphoma with recurrent translocations and amplifications. (A) FACS analyses of CD4 and CD8 expression on WT, Atm−/−, −/−, and Atm−/−−/− thymocytes. The number at the top right quadrant of each dot plot indicates the percentage of CD4+CD8+ DP T cells in total live thymocytes. Surface CD3 levels of gated DP cells (gated on top right quadrant of the dot plot) are plotted on the histogram on the right. The total thymocyte number (average ± standard deviation) from at least three mice of each genotype (at 4–6 wk of age) is marked in the top right corner of the histogram plots. FACS analyses were performed for at least three mice of each genotype independently, and representative plots are shown. (B) Survival analysis of Atm−/−−/− mice and littermate control Atm−/− and −/− mice. (C) Representative chromosome paints and FISH analyses show t(12:14) translocations involving the Tcra/d locus in one Atm−/−−/− thymic lymphoma (6099). The red arrow indicates the normal chromosome 14 and the arrowhead indicates the t(12;14) translocations. Similar results were obtained for all five Atm−/−−/− thymic lymphomas analyzed. 20 metaphases were analyzed from each tumor, and >80% of the metaphases from each tumor had the clonal t(12;14) translocation. (D) Representative CGH analyses of Atm−/−−/− thymic lymphoma DNA. CGH analyses were performed once for each tumor. The analysis shown is for DNA from tumor 5696 and is representative of the results from CGH analyses of five Atm−/−−/− thymic lymphomas. The y axis is amplification/deletion index (LN tumor/kidney ratio of each tumor analyzed). The x axis depicts the 20 mouse chromosomes as indicated (1–19 plus chromosome x and y and centromere to telomere). Red arrows and text indicate recurrent amplifications of sequences corresponding to the Notch1 and Chr14amp probes, as well as trisomy of chr 15 (Tric15). The black arrows and text indicates the various TCR loci. The green arrow and text indicates recurrent deletions in the telomeric portion of chromosome 12 (Δtch12).

References

    1. Aifantis I., Raetz E., Buonamici S. 2008. Molecular pathogenesis of T-cell leukaemia and lymphoma. Nat. Rev. Immunol. 8:380–390 10.1038/nri2304 - DOI - PubMed
    1. Armstrong S.A., Look A.T. 2005. Molecular genetics of acute lymphoblastic leukemia. J. Clin. Oncol. 23:6306–6315 10.1200/JCO.2005.05.047 - DOI - PubMed
    1. Barlow C., Hirotsune S., Paylor R., Liyanage M., Eckhaus M., Collins F., Shiloh Y., Crawley J.N., Ried T., Tagle D., Wynshaw-Boris A. 1996. Atm-deficient mice: a paradigm of ataxia telangiectasia. Cell. 86:159–171 10.1016/S0092-8674(00)80086-0 - DOI - PubMed
    1. Bassing C.H., Swat W., Alt F.W. 2002. The mechanism and regulation of chromosomal V(D)J recombination. Cell. 109(Suppl):S45–S55 10.1016/S0092-8674(02)00675-X - DOI - PubMed
    1. Bassing C.H., Suh H., Ferguson D.O., Chua K.F., Manis J., Eckersdorff M., Gleason M., Bronson R., Lee C., Alt F.W. 2003. Histone H2AX: a dosage-dependent suppressor of oncogenic translocations and tumors. Cell. 114:359–370 10.1016/S0092-8674(03)00566-X - DOI - PubMed

Publication types

MeSH terms

Substances