. 2010 Jul 5;207(7):1485-500.
doi: 10.1084/jem.20092695. Epub 2010 Jun 21.

Type I IFN enhances follicular B cell contribution to the T cell-independent antibody response

Affiliations

Type I IFN enhances follicular B cell contribution to the T cell-independent antibody response

Cristina L Swanson et al. J Exp Med. .

Abstract

Humoral immunity to viruses and encapsulated bacteria is comprised of T cell-independent type 2 (TI-2) antibody responses that are characterized by rapid antibody production by marginal zone and B1 B cells. We demonstrate that toll-like receptor (TLR) ligands influence the TI-2 antibody response not only by enhancing the overall magnitude but also by skewing this response to one that is dominated by IgG isotypes. Importantly, TLR ligands facilitate this response by inducing type I interferon (IFN), which in turn elicits rapid and significant amounts of antigen-specific IgG2c predominantly from FO (follicular) B cells. Furthermore, we show that although the IgG2c antibody response requires B cell-autonomous IFN-alpha receptor signaling, it is independent of B cell-intrinsic TLR signaling. Thus, innate signals have the capacity to enhance TI-2 antibody responses by promoting participation of FO B cells, which then elaborate effective IgG anti-pathogen antibodies.


Figures

Figure 1.
Figure 1.
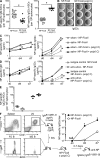
Poly(I:C) enhances the antibody response to a model TI-2 antigen. (A) C57BL/6 mice were immunized with 5 µg NP-Ficoll alone or 5 µg NP-Ficoll + 100 µg poly(I:C) and serum NP-specific IgM, IgG3, and IgG2c antibodies were measured in preimmune (day 0 [d0]), day 4, and day 7 after immunization sera. Symbols represent individual mice, and horizontal bars indicate geometric mean. Data were combined from two independent experiments with five mice per group per experiment. *, P ≤ 0.005. (B) Total serum NP-specific IgG2c, IgG3, IgG2b, IgG1, and IgM were measured 7 d after immunization with NP-Ficoll ± poly(I:C). Data represent geometric means calculated from data combined from two independent experiments, with five mice per group per experiment. Geometric means from NP-specific IgM, IgG3, and IgG2c responses were the same as those represented in A.
Figure 2.
Figure 2.
Poly(I:C) promotes a long-lived, extrafollicular, and low-affinity IgG2c antibody response to NP-Ficoll. (A) C57BL/6 mice were immunized with either NP-Ficoll alone or with poly(I:C) and serum NP-specific IgG2c antibodies measured before and at the indicated days after immunization. Data are expressed as the geometric mean ± SEM. Results shown are from one representative experiment of two independent experiments performed. *, P ≤ 0.002. (B) Histological spleen sections from C57BL/6 mice 7 d after immunization with NP-Ficoll or NP-Ficoll + poly(I:C). Top panels show sections stained for Igλ, IgM, and IgG2c. B cell follicles within the white pulp were revealed by IgM staining to provide orientation for the general lymphoid architecture. Top panels are 10× original magnification with enlarged areas within white outlined boxes represented in middle and bottom panels. Bottom panels depict only green Igλ+ ASCs and white arrows identify IgG2c ASCs. Bars, 50 µm. Data are representative of two independent experiments. (C) Relative affinity of NP-specific IgG2c antibodies was determined as the binding ratio of NP4/NP16 and was measured by ELISA. Sera samples were analyzed from mice at 7, 14, and 31 d after immunization with NP-Ficoll or NP-Ficoll + poly(I:C). Results were combined from two independent experiments with four to eight mice per immunization group. Data are expressed as the arithmetic mean ± SEM. The NP-specific IgG2c mAb S43-10 was used as a positive control for a high-affinity binding antibody.
Figure 3.
Figure 3.
Poly(I:C) elicits recruitment of FO B cells to participate in the enhanced IgG2c TI-2 antibody response. (A) Frequency of splenic NP-specific IgM and IgG2c ASCs as measured by ELISPOT 7 d after immunization with either NP-Ficoll alone or NP-Ficoll + poly(I:C). Each symbol represents an individual mouse and horizontal bars indicate either mean (IgM) or geometric mean (IgG2c). Data was combined from four independent experiments with three to five mice per group per experiment. *, P < 0.0001. (B) ELISPOT of NP-specific IgG2c ASCs in lymph nodes from C57BL/6 mice at 7 d after immunization with either NP-Ficoll alone or NP-Ficoll + poly(I:C). Lymph nodes were pooled from three immunized mice. Data was from two representative samples shown for each immunization condition. Data was from one experiment of two independent experiments performed. (C) Wild-type splenectomized or sham-operated mice were immunized with NP-Ficoll alone or NP-Ficoll + poly(I:C) and serum NP-specific IgM and IgG2c antibody measured at days 0, 4, and 7 after immunization. Data are expressed as the geometric mean + SEM. Results were combined from two independent experiments with four to six mice per group per experiment. *, P < 0.05. (D) C57BL/6 mice were treated with 100 µg each of anti-α4 + anti-αL antibodies or isotype control antibodies. 7 d after antibody injection, mice were immunized with either NP-Ficoll alone or NP-Ficoll + poly(I:C) and serum NP-specific IgM and IgG2c antibody responses measured at the indicated times. Data are expressed as the geometric mean + SEM. Results are from one experiment with four to five mice per group. *, P < 0.05. (E) Frequency of NP-specific IgG2c splenic ASCs measured from antibody-treated wild-type mice. Symbols are the same as those described in D and represent the frequency measured from individual animals. Horizontal bars indicate geometric mean. Results are from one experiment with four mice per group. (F) Representative flow cytometric analysis of CD21 and CD23 expression in spleen and lymph node of BL6-IghB1-8/B1-8 (Igha) mice. Total lymph node cells (5 × 10⁷) were transferred to C57BL/6 (Ighb) mice and immunized 1 d later. The presence and phenotype of transferred Igha+ lymph node B cells within a splenic FO B cell gate (CD21int CD23high) and MZ B cell gate (CD21high CD23low) in one representative recipient 1 d after transfer is shown. Recipient mice were immunized with either NP-Ficoll alone or NP-Ficoll + poly(I:C) and NP-specific IgG2a antibodies measured in sera at the indicated time points. Antibody concentrations are shown as relative titers and data are expressed as the geometric mean ± SEM. Results shown from one representative experiment of two independent experiments performed, with four mice per group. n.d., not detected. *, P ≤ 0.0003.
Figure 4.
Figure 4.
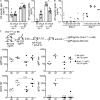
The TI-2 IgG2c response induced by poly(I:C) is not mediated by B cell–intrinsic TLR3 signaling. (A) NP-specific IgG2c responses in wild type, Tlr3−/−, Mda5−/−, and Tlr3−/− Mda5−/− mice measured from sera collected preimmunization (day 0) and at 7 d after NP-Ficoll + poly(I:C) immunization. Symbols represent individual mice, and horizontal bars indicate geometric mean. Shown is one representative of two independent experiments performed, with four to five mice per group. *, P < 0.05. (B) NP-specific IgG2c/a antibody responses in mixed bone marrow chimeras 7 d after immunization with NP-Ficoll + poly(I:C). A mixture of bone marrow cells from B6.C20 (Igha) and Tlr3−/− (Ighb; experimental chimeras; filled) or B6.C20 and wild-type C57BL/6 (Ighb; control chimeras; open) was adoptively transferred to lethally irradiated B6.C20 hosts. 8 wk after reconstitution, chimeras were immunized and NP-specific antibody measured in preimmune and day-7 sera. Reconstitution frequencies of IgMa- and IgMb-expressing B cells were measured as described in the Materials and methods and found to be equivalent between both experimental and control chimeras. Symbols represent individual chimeric mice, and horizontal bars indicate geometric mean. Data were combined from two independent experiments with five to six mice per group. n.d., not detected.
Figure 5.
Figure 5.
Poly(I:C) induction of IgG2c requires type I IFN receptor signaling by B cells. (A) NP-specific IgM and IgG2c responses in wild-type and Ifnar1−/− mice measured from sera collected at days 0 and 7 after immunization with NP-Ficoll + poly(I:C). Symbols represent individual mice, and bars represent geometric means. Data were combined from two independent experiments with three to five mice per group per experiment. *, P ≤ 0.005. (B) C57BL/6 mice were immunized with 5 µg NP-Ficoll alone or in the presence of 100 µg Pam3CSK4 (TLR1/2), 100 µg poly(I:C) (TLR3), 100 µg 3M-012 (TLR7), or 8 × 10⁵ U rIFN-α11. NP-specific IgG2c responses were measured from sera collected preimmune (day 0) and at 7 d after immunization. Symbols represent individual mice, and horizontal bars indicate geometric mean. Shown is one representative of two independent experiments performed, with four mice per group. (C) Mixed bone marrow chimeras were generated as described in Fig. 2 B, except that experimental chimeras were generated from the transfer of Ifnar1−/− (Ighb) + B6.C20 (Igha) bone marrow. After reconstitution, chimeric mice were immunized with NP-Ficoll + poly(I:C) and NP-specific IgMa, IgMb, IgG2a, and IgG2c serum antibody responses measured preimmune (day 0) and at 7 d after immunization. Symbols represent individual mice, and horizontal bars indicate geometric mean. Representative data are from one experiment shown of two independent experiments performed, with four mice per group. n.d., not detected. *, P < 0.05.
Figure 6.
Figure 6.
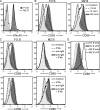
IFN-α induces BCR-stimulated FO B cells to up-regulate CD69 to a greater extent than MZ B cells. (A) Histograms represent flow cytometric analysis of IFNαR1 surface expression on CD21int CD23high FO B cells and CD21high CD23low MZ B cells isolated from naive wild-type mice. Isotype control antibody staining for both FO (shaded light gray) and MZ (dashed line) B cells is provided. Data are representative from two independent experiments. (B–D) FO and MZ B cells were sorted to ≥94% purity from naive C57BL/6 mice and separately incubated with the indicated stimuli in vitro for 6 or 10 h. After stimulation, surface expression of CD69 (6 h) or CD86 (10 h) was subsequently assessed in both B cell populations by flow cytometry and data depicted as histograms. The following stimuli and doses were used: (B) rIFN-α at 1, 10, or 100 U/ml; (C) rIFN-α at 1 U/ml and anti-IgM F(ab′)2 at 10 µg/ml; (D) LPS at 10 µg/ml. Med, medium. Data are representative from at least two independent experiments.

Similar articles

Cited by

References

    1. Alexopoulou L., Holt A.C., Medzhitov R., Flavell R.A. 2001. Recognition of double-stranded RNA and activation of NF-kappaB by Toll-like receptor 3. Nature. 413:732–738 10.1038/35099560 - DOI - PubMed
    1. Amlot P.L., Grennan D., Humphrey J.H. 1985. Splenic dependence of the antibody response to thymus-independent (TI-2) antigens. Eur. J. Immunol. 15:508–512 10.1002/eji.1830150516 - DOI - PubMed
    1. Baccala R., Hoebe K., Kono D.H., Beutler B., Theofilopoulos A.N. 2007. TLR-dependent and TLR-independent pathways of type I interferon induction in systemic autoimmunity. Nat. Med. 13:543–551 10.1038/nm1590 - DOI - PubMed
    1. Bachmann M.F., Zinkernagel R.M. 1997. Neutralizing antiviral B cell responses. Annu. Rev. Immunol. 15:235–270 10.1146/annurev.immunol.15.1.235 - DOI - PubMed
    1. Bachmann M.F., Hengartner H., Zinkernagel R.M. 1995. T helper cell-independent neutralizing B cell response against vesicular stomatitis virus: role of antigen patterns in B cell induction? Eur. J. Immunol. 25:3445–3451 10.1002/eji.1830251236 - DOI - PubMed

Publication types

MeSH terms

Associated data