. 2010 Aug;177(2):575-85.
doi: 10.2353/ajpath.2010.081068. Epub 2010 Jun 21.

Abnormalities in mitochondrial structure in cells from patients with bipolar disorder

Affiliations

Abnormalities in mitochondrial structure in cells from patients with bipolar disorder

Anne M Cataldo et al. Am J Pathol. 2010 Aug.

Abstract

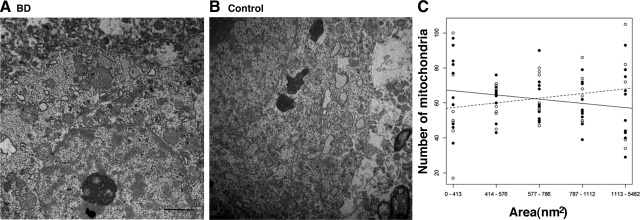
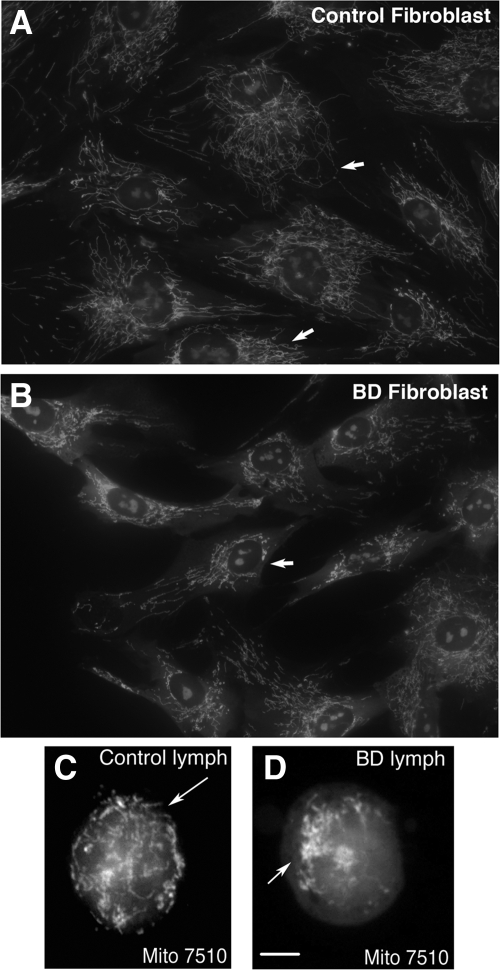
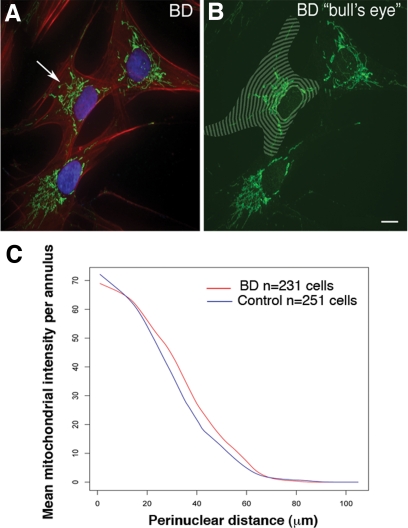
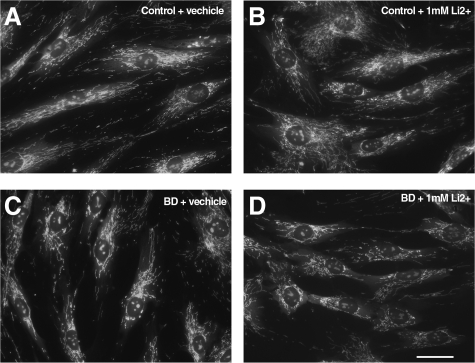
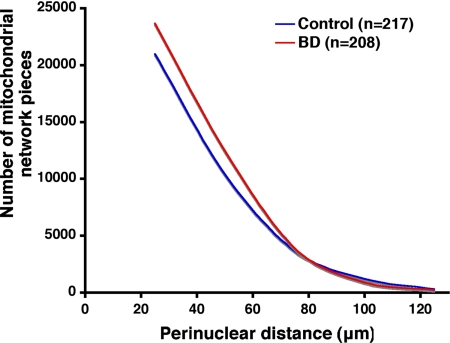
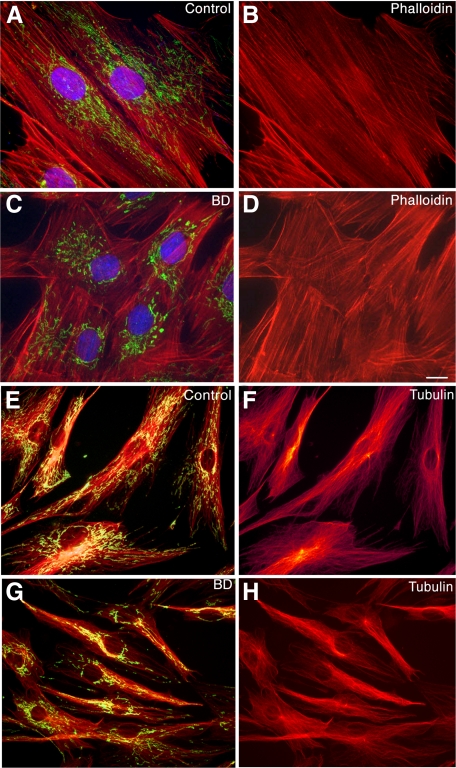
Postmortem, genetic, brain imaging, and peripheral cell studies all support decreased mitochondrial activity as a factor in the manifestation of Bipolar Disorder (BD). Because abnormal mitochondrial morphology is often linked to altered energy metabolism, we investigated whether changes in mitochondrial structure were present in brain and peripheral cells of patients with BD. Mitochondria from patients with BD exhibited size and distributional abnormalities compared with psychiatrically-healthy age-matched controls. Specifically, in brain, individual mitochondria profiles had significantly smaller areas, on average, in BD samples (P = 0.03). In peripheral cells, mitochondria in BD samples were concentrated proportionately more within the perinuclear region than in distal processes (P = 0.0008). These mitochondrial changes did not appear to be correlated with exposure to lithium. Also, these abnormalities in brain and peripheral cells were independent of substantial changes in the actin or tubulin cytoskeleton with which mitochondria interact. The observed changes in mitochondrial size and distribution may be linked to energy deficits and, therefore, may have consequences for cell plasticity, resilience, and survival in patients with BD, especially in brain, which has a high-energy requirement. The findings may have implications for diagnosis, if they are specific to BD, and for treatment, if they provide clues as to the underlying pathophysiology of BD.


Figures

Figure 1
Figure 1
Neurons of patients with BD display alterations in mitochondrial area. Representative ultrastructural images of the prefrontal cortex of BD (A) and control brain (B). Scale bar = 2 μm (A and B). C: Plot of the number of mitochondria in each of five quintiles of mitochondrial area in cells of PFC. Solid line and filled circles are BD. Dashed line and open circles are control.
Figure 2
Figure 2
Mitochondrial clustering in primary cells from patients with BD. Compared with control cells (A, fibroblast, and C, lymphocyte), primary fibroblasts (B) and lymphocytes (D) from patients with BD show altered mitochondrial morphology and distribution (arrows point to features to compare between cells, including the greater clustering of mitochondria around the nucleus and the relative paucity of mitochondria near the external cell membrane in BD). In the majority (greater than 70%) of BD cells, perinuclear clusters, revealed using Mitotracker 7510 fluorescence, were observed. Magnification: ×630 (A and B), ×1000 (C and D). Scale bar = 10 μm.
Figure 3
Figure 3
Analysis of mitochondrial distribution in cells from patients with BD. Morphometric analysis of mitochondrial spatial distribution, identified with Mitotracker 7510 (green), in human fibroblasts from normal controls (n = 251 cells) and patients with BD (n = 231 cells). A representative cell from a BD patient is shown with an arrow pointing to the mitochondrial network (A). Concentric annuli in the shape of each nuclear envelope were placed to align with the centroids of each nucleus (B) to cover the spatial extent of each fibroblast. BD cells exhibit higher mitochondrial densities (square root scale) than those of the control group in the 15–70 μm range. Our random effects analysis of covariance of mitochondrial staining revealed that in the BD group of cells (red) there was a significantly steeper density decline than in the control group (blue) with distance from the nucleus (C) (diagnosis by distance interaction P = 0.0008). Scale bar = 10 μm (A and B).
Figure 4
Figure 4
Lithium treatment does not cause mitochondrial abnormalities in control fibroblasts or rescue mitochondrial abnormalities in BD fibroblasts. Light microscopic examination of human fibroblasts, from psychiatrically-healthy control and BD subjects, (B) and (D) or vehicle (A) and (C) each exposed to LiCO3 at 1 mmol/L 5 days and labeled with M 7510. Analysis revealed no significant differences in mitochondrial shape and distribution compared with fibroblasts treated with vehicle only.
Figure 5
Figure 5
Cytochrome C expression shows an altered distribution in BD fibroblasts. Distributional analysis of cytochrome C immunocytochemistry demonstrated an altered distribution of the mitochondria network in BD fibroblasts as compared with Control fibroblasts. (two-sample t test; P < 0.0001).
Figure 6
Figure 6
No substantial changes in the actin or tubulin cytoskeleton are seen that correlate with diagnosis in BD fibroblasts. Representative images of fibroblasts from patients with BD (C, D, G, and H) and healthy controls (A, B, E, and F) labeled with probes for mitochondria (M 7510 green A and C, and orange E and G), filamentous actin (red, phalloidin AD), and tubulin β (red, EH). The results confirm mitochondrial redistribution in the BD fibroblasts compared with controls. However, abnormalities in mitochondrial shape and distribution were not accompanied by changes in the actin cytoskeleton, observed by phalloidin, or antibodies to tubulin β I and II, when compared with healthy controls. In addition, fluorescent staining of fibroblasts with the DNA-binding dyes, DAPI (A and C blue label) or bisbenzimide (not shown), revealed no evidence of increased apoptosis or nuclear fragmentation in the BD cells. Magnification: ×1000 (AD), ×630 (EH). Scale bar = 10 μm.

Similar articles

Cited by

References

    1. Berns GS, Nemeroff CB. The neurobiology of bipolar disorder. Am J Med Genet C Semin Med Genet. 2003;123C:76–84. - PubMed
    1. Rajkowska G. Cell pathology in bipolar disorder. Bipolar Disord. 2002;4:105–116. - PubMed
    1. Quiroz JA, Gray NA, Kato T, Manji HK. Mitochondrially mediated plasticity in the pathophysiology and treatment of bipolar disorder. Neuropsychopharmacology. 2008;33:2551–2565. - PubMed
    1. Kato T, Stine OC, McMahon FJ, Crowe RR. Increased levels of a mitochondrial DNA deletion in the brain of patients with bipolar disorder. Biol Psychiatry. 1997;42:871–875. - PubMed
    1. Konradi C, Eaton M, MacDonald ML, Walsh J, Benes FM, Heckers S. Molecular evidence for mitochondrial dysfunction in bipolar disorder. Arch Gen Psychiatry. 2004;61:300–308. - PubMed

Publication types

MeSH terms