. 2010 Jul 15;185(2):1114-23.
doi: 10.4049/jimmunol.1001143. Epub 2010 Jun 21.

Innate retroviral restriction by Apobec3 promotes antibody affinity maturation in vivo

Affiliations

Innate retroviral restriction by Apobec3 promotes antibody affinity maturation in vivo

Mario L Santiago et al. J Immunol. .

Abstract

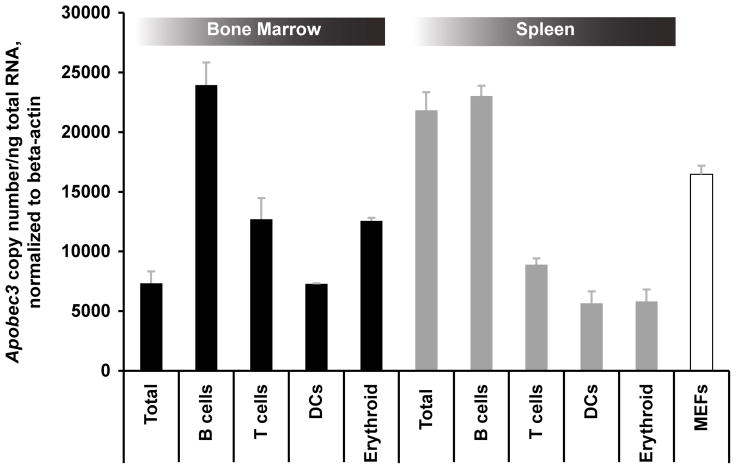
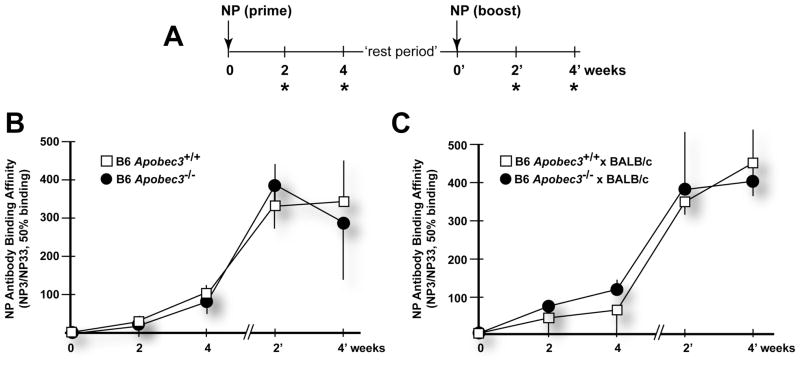
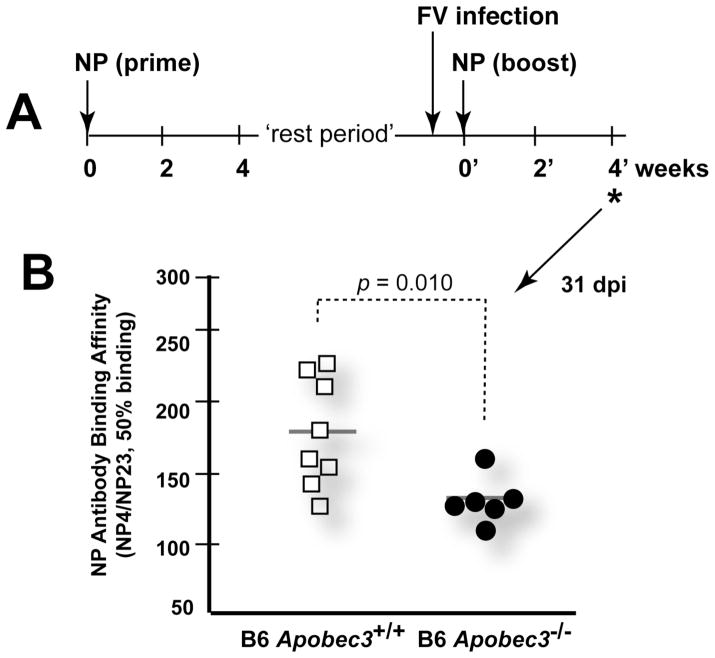
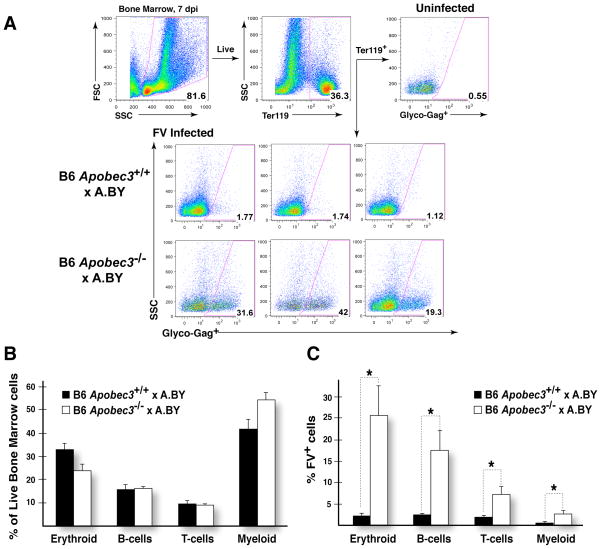
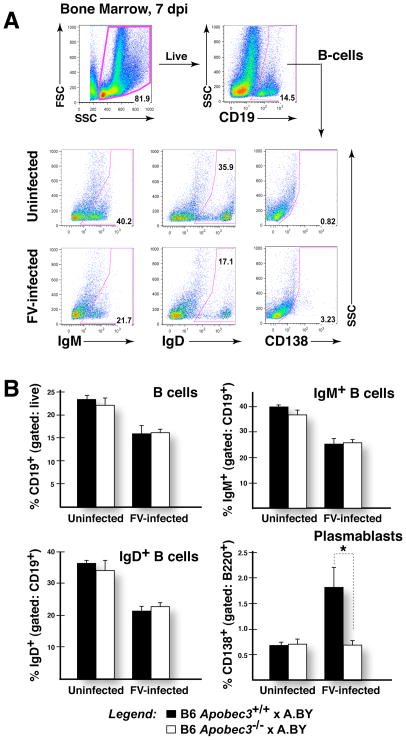
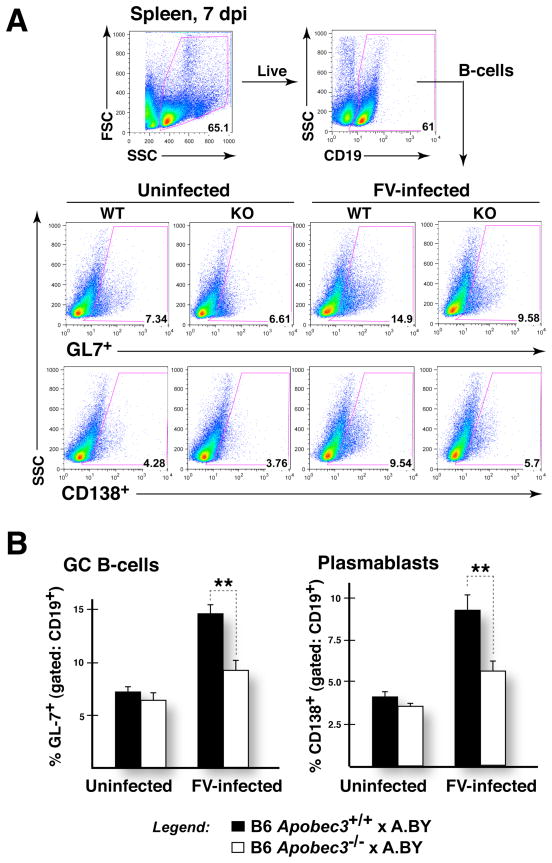
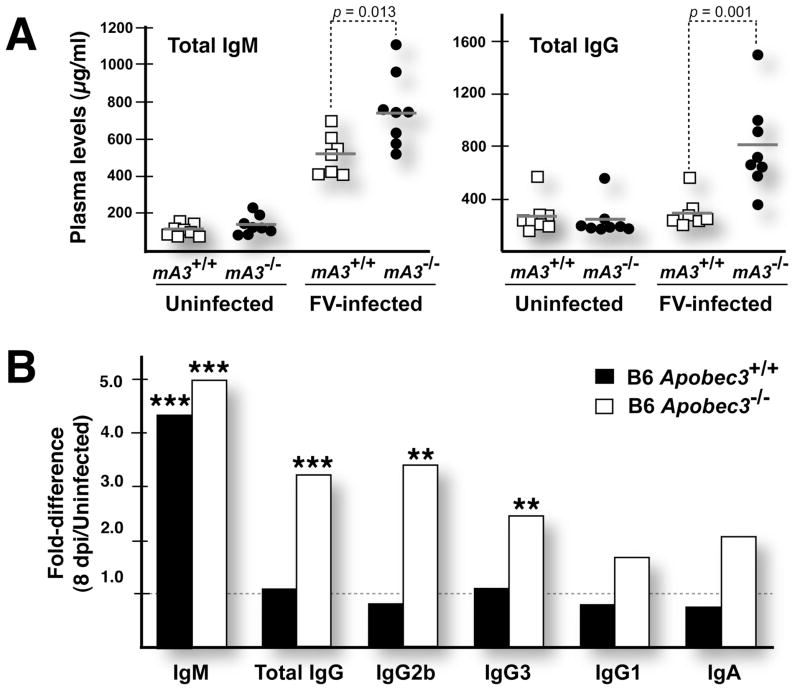
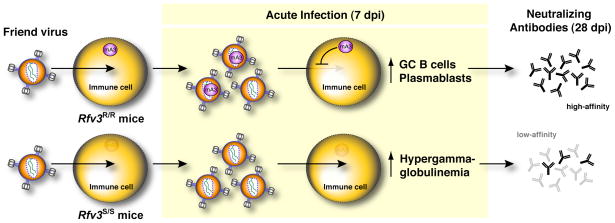
Apobec3/Rfv3 is an innate immune factor that promotes the neutralizing Ab response against Friend retrovirus (FV) in infected mice. Based on its evolutionary relationship to activation-induced deaminase, Apobec3 might directly influence Ab class switching and affinity maturation independently of viral infection. Alternatively, the antiviral activity of Apobec3 may indirectly influence neutralizing Ab responses by reducing early FV-induced pathology in critical immune compartments. To distinguish between these possibilities, we immunized wild-type and Apobec3-deficient C57BL/6 (B6) mice with (4-hydroxy-3-nitrophenyl) acetyl (NP) hapten and evaluated the binding affinity of the resultant NP-specific Abs. These studies revealed similar affinity maturation of NP-specific IgG1 Abs between wild-type and Apobec3-deficient mice in the absence of FV infection. In contrast, hapten-specific Ab affinity maturation was significantly compromised in Apobec3-deficient mice infected with FV. In highly susceptible (B6 x A.BY)F(1) mice, the B6 Apobec3 gene protected multiple cell types in the bone marrow and spleen from acute FV infection, including erythroid, B, T, and myeloid cells. In addition, B6 Apobec3 deficiency was associated with elevated Ig levels, but decreased induction of splenic germinal center B cells and plasmablasts during acute FV infection. These data suggest that Apobec3 indirectly influences FV-specific neutralizing Ab responses by reducing virus-induced immune dysfunction. These findings raise the possibility that enabling Apobec3 activity during acute infection with human pathogenic retroviruses, such as HIV-1, may similarly facilitate stronger virus-specific neutralizing Ab responses.


Figures

Figure 1
Figure 1
Expression of Apobec3 mRNA in bone marrow and spleen cell subpopulations. B-cells (CD19+), T-cells (CD90.2+), erythroid (Ter119+) and dendritic cells (CD11c+) were magnetically purified from bone marrow or spleen in B6 mice and subjected to quantitative RT-PCR. Mouse embryonic fibroblasts (MEFs) were derived from B6 mice. Note that all of these cell subpopulations express readily detectable Apobec3 mRNA, with the highest levels of expression found in B cells.
Figure 2
Figure 2
Apobec3 does not influence NP-specific IgG1 affinity maturation. (A) Immunization schedule. Mice were primed and boosted with 100 μg NP26-CGG and plasma samples collected at 2 and 4 weeks after priming and boosting (*). Timepoints from the time of the NP-boost were designated as weeks 0′, 2′ and 4′. The “rest period” corresponds to the time interval between the bleed 4 weeks after NP-priming and the timepoint of NP-boosting. (B) Kinetics of NP-specific antibody affinity maturation in B6 mice. Plasma samples from B6 Apobec3+/+ (n=7) and Apobec3−/− mice (n=7) were subjected to a differential NP-binding ELISA. The relative binding affinity of NP-specific antibodies was expressed as the ratio of the mean 50% binding titers to low (NP3)- versus high (NP33)-molar hapten reactivities multiplied by 100. Standard deviations were indicated as vertical lines. The rest period for this cohort was 2 weeks. (C) Kinetics of affinity maturation in (B6 x BALB/c)F1mice. Plasma samples from (B6 Apobec3+/+ x BALB/c) F1 (n=7) and (B6 Apobec3−/− x BALB/c) F1 (n=7) were subjected to a differential NP-ELISA and relative binding affinities are shown. The rest period for this cohort was 2 weeks.
Figure 3
Figure 3
Apobec3 promotes NP-specific antibody affinity maturation in the context of FV infection. (A) FV infection prior to NP boosting. Three days prior to boosting with 100μg NP26-CGG, the primed mice were infected with 7500 SFFU of FV. The relative binding affinity of NP-specific antibodies were measured 4 weeks (*) following the NP-boost. This timepoint corresponds to 31 days post-infection (dpi). The rest period corresponds to the time interval between the bleed 4 weeks after NP-priming and the timepoint of NP-boosting, and corresponds to 16 weeks for this cohort. (B) Antibody affinity was estimated using a differential NP ELISA. NP-specific antibodies from B6 Apobec3−/− mice showed significantly lower binding affinity compared to wild-type mice. p values were calculated using a 2-tailed Student’s t test.
Figure 4
Figure 4
B6 Apobec3 protects specific subpopulations of bone marrow cells from acute FV infection. (A) Gating strategy for assessing FV infection. Live bone marrow cells were gated based on forward and side scatter, and the percentage of specific cell subpopulations (in this case Ter119+erythroblasts) was assessed within this live cell population. A Glyco-gag-specific monoclonal antibody (MAb 34), coupled with APC-conjugated secondary antibody, was used to detect FV-infected cells. Uninfected cells had <1% reactivity with MAb34. Using these gates, the percentages of FV+ cells were estimated. Representative panels from B6 Apobec3+ and deficient F1 mice are highlighted. (B) Bone marrow cell subpopulations in FV infected mice. The proportion of erythroid (Ter119+), B (CD19+), T (CD3+) and myeloid (CD11b+) cells in live bone marrow cells were quantified. There was no significant difference in the proportion of these cell subpopulations found in B6 Apobec3+ (n=8) and B6 Apobec3-deficient (n=8) F1 mice. Error bars depict standard error of the mean. (C) Higher levels of FV-infected cells in multiple bone marrow subpopulations were detected in mice lacking B6 Apobec3. FV+ erythroid, B, T and myeloid cells were quantified by flow cytometry. Statistical analyses were performed using a 2-tailed Student’s t-test: *, p<0.05. The data corresponds to Cohort 2 as outlined in Table I.
Figure 5
Figure 5
Bone marrow B-cell perturbations in FV-infected B6 Apobec3+ and B6 Apobec3-deficient F1 mice. (A) Gating strategy. B-cells (CD19+ or B220+) present within the live cell gate were analyzed for the proportion of IgM+, IgD+ and CD138+. (B) B-cell subpopulations in infected versus uninfected mice. The mean percentages were plotted, with vertical lines depicting the standard error of the mean. The samples sizes were: (B6 Apobec3+/+ x A.BY) F1 (uninfected, n=7; infected, n=8); (B6 Apobec3−/− x A.BY) F1 (uninfected, n=7; infected, n=8). Data were subjected to a 2-tailed Student’s t-test. *, p<0.05. FV infection resulted in a decline in total, IgM+ and IgD+ B cells. In contrast, CD138+ B cells (plasmablasts) were preferentially induced in FV-infected B6 Apobec3+ F1 mice.
Figure 6
Figure 6
Suppressed induction of splenic germinal center B cells and plasmablasts in FV-infected B6 Apobec3-deficient F1 mice. (A) Gating strategy. The proportion of live B-cells (CD19+) that express the germinal center marker GL7 and plasmablast marker CD138 were quantified in groups of FV-infected and uninfected B6 Apobec3+ and B6 Apobec3-deficient F1 mice (n=6 mice for each group). (B) Germinal center B cells and plasmablasts in the spleen. Higher levels of GL7+ B cells (Upper panel) and CD138+ plasmablasts (Lower panel) were detected in FV-infected B6 Apobec3+ F1 mice compared to B6 Apobec3-deficient F1 mice. Mean values were subjected to a 2-tailed Student’s t-test; **, p<0.01. Error bars correspond to the standard error of the mean.
Figure 7
Figure 7
Hypergammaglobulinemia in FV-infected B6 Apobec3-deficient mice. (A) Total IgM and IgG titers in FV infected mice. Plasma titers of IgM and IgG were determined in acutely infected and uninfected wild-type (□) and Apobec3-deficient (●) B6 mice. Horizontal gray bars correspond to mean levels. Data were analyzed and p values calculated using a 2-tailed Student’s t-test. In the upper panel, mouse Apobec3 was abbreviated as ‘mA3’. Acute FV infection increased IgM titers in both strains of mice, but total IgG levels were selectively upregulated in Apobec3-deficient mice. (B) Induction of IgG subclasses during acute FV infection. “Fold-difference” corresponds to the mean immunoglobulin levels of FV infected (n=7–8) divided by the mean levels in uninfected mice (n=8). The difference in immunoglobulin titers between the infected and uninfected mice were subjected to a 2-tailed Student’s t-test. ***, p<0.001; **, p<0.01. Selective upregulation of total IgG in Apobec3-deficient mice was likely due to induced levels of IgG2b and IgG3.
Figure 8
Figure 8
Working model for how Apobec3 influences the FV-specific neutralizing antibody response. Acute FV infection of multiple immune cells (erythroid, B, T and myeloid) which express Apobec3 (upper row) results in the release of noninfectious particles containing Apobec3 that in next round of infection display reduced infectivity for target cells. At the same time, these Apobec3+ viral particles could prime virus-specific antibody responses by presenting native envelope trimers. Reduced pathology in the presence of viral antigen results in the induction of germinal center B cells and plasmablasts that eventually translate to the development of high-affinity virus-specific antibodies. In Apobec3-deficient/Rfv3 susceptible mice (lower row), uncontrolled FV replication in B cells, and possibly other immune cells, results in aberrant polyclonal B cell activation as highlighted by hypergammaglobulinemia and suppressed B cell responses. This translates to delayed affinity maturation of virus-specific antibodies. In this model, we hypothesize that high-affinity envelope-specific antibodies contribute significantly to a potent neutralizing antibody response.

Similar articles

Cited by

References

    1. Hasenkrug KJ, Dittmer U. Immune control and prevention of chronic Friend retrovirus infection. Front Biosci. 2007;12:1544–1551. - PubMed
    1. Miyazawa M, Tsuji-Kawahara S, Kanari Y. Host genetic factors that control immune responses to retrovirus infections. Vaccine. 2008;26:2981–2996. - PubMed
    1. Lilly F. Fv-2: identification and location of a second gene governing the spleen focus response to Friend leukemia virus in mice. Journal of the National Cancer Institute. 1970;45:163–169. - PubMed
    1. Persons DA, Paulson RF, Loyd MR, Herley MT, Bodner SM, Bernstein A, Correll PH, Ney PA. Fv2 encodes a truncated form of the Stk receptor tyrosine kinase. Nat Genet. 1999;23:159–165. - PubMed
    1. Chesebro B, Wehrly K. Studies on the role of the host immune response in recovery from Friend virus leukemia. II. Cell-mediated immunity. The Journal of experimental medicine. 1976;143:85–99. - PMC - PubMed

Publication types

MeSH terms