. 2010 Jul 6;107(27):12204-9.
doi: 10.1073/pnas.0909122107. Epub 2010 Jun 21.

Inducible Foxp3+ regulatory T-cell development by a commensal bacterium of the intestinal microbiota

Affiliations

Inducible Foxp3+ regulatory T-cell development by a commensal bacterium of the intestinal microbiota

June L Round et al. Proc Natl Acad Sci U S A. .

Abstract

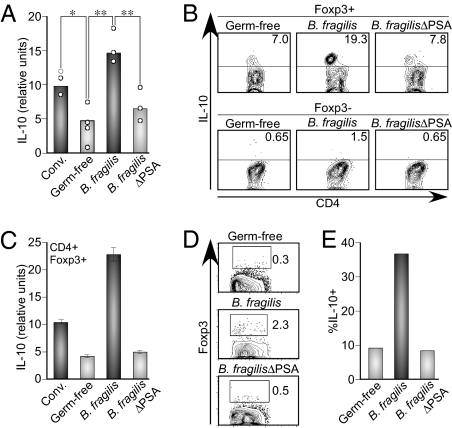
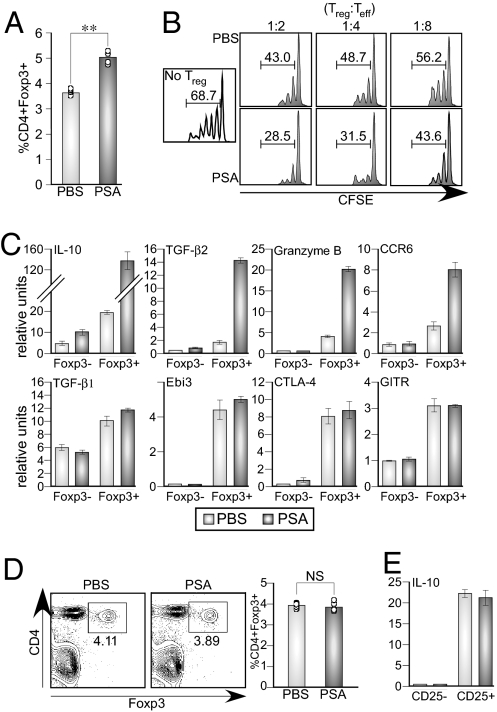
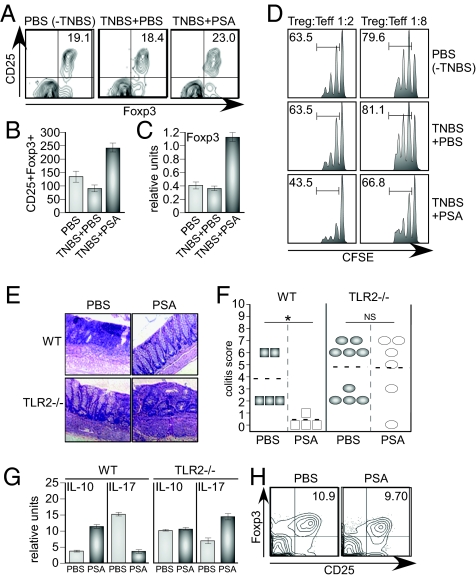
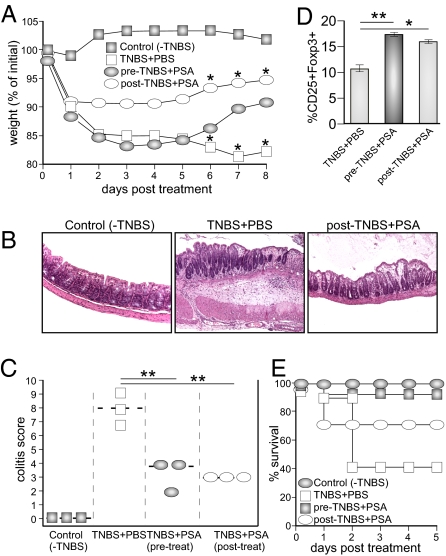
To maintain intestinal health, the immune system must faithfully respond to antigens from pathogenic microbes while limiting reactions to self-molecules. The gastrointestinal tract represents a unique challenge to the immune system, as it is permanently colonized by a diverse amalgam of bacterial phylotypes producing multitudes of foreign microbial products. Evidence from human and animal studies indicates that inflammatory bowel disease results from uncontrolled inflammation to the intestinal microbiota. However, molecular mechanisms that actively promote mucosal tolerance to the microbiota remain unknown. We report herein that a prominent human commensal, Bacteroides fragilis, directs the development of Foxp3(+) regulatory T cells (Tregs) with a unique "inducible" genetic signature. Monocolonization of germ-free animals with B. fragilis increases the suppressive capacity of Tregs and induces anti-inflammatory cytokine production exclusively from Foxp3(+) T cells in the gut. We show that the immunomodulatory molecule, polysaccharide A (PSA), of B. fragilis mediates the conversion of CD4(+) T cells into Foxp3(+) Treg cells that produce IL-10 during commensal colonization. Functional Foxp3(+) Treg cells are also produced by PSA during intestinal inflammation, and Toll-like receptor 2 signaling is required for both Treg induction and IL-10 expression. Most significantly, we show that PSA is not only able to prevent, but also cure experimental colitis in animals. Our results therefore demonstrate that B. fragilis co-opts the Treg lineage differentiation pathway in the gut to actively induce mucosal tolerance.


Conflict of interest statement

The authors declare no conflict of interest.

Figures

Fig. 1.
Fig. 1.
Bacteroides fragilis colonization elicits tolerant T cell responses in the intestine. (A) Germ-free C57BL/6 mice were reconstituted with Foxp3-GFP bone marrow and colonized with bacteria as indicated (Conv. refers to specific pathogen-free conventional mice). RNA was extracted from the colons of mice and IL-10 measured by qRT-PCR. Each symbol indicates an individual mouse. *P < 0.05; **P < 0.01. These data are representative of two independent trials with at least three mice in each group. (B) Lamina propria lymphocytes were assessed for IL-10 from CD4+Foxp3+ and CD4+Foxp3 subsets by flow cytometry (FC). These data are representative of three independent trials. (C) Cells from the MLNs of mice were purified to isolate CD4+Foxp3-GFP T cells. RNA was extracted and the IL-10 transcript levels analyzed by qRT-PCR. Cell populations were >99% pure. Error bars indicate SD from samples run in triplicate from the same experiment. These data are representative of two independent trials with at least four mice per group. (D and E) Germ-free C57BL/6 Rag−/− animals were sublethally irradiated and CD4+Foxp3 T cells transferred from Foxp3-GFP donor mice. Cell purity was always >99%. Animals were either left germ-free or colonized with indicated bacterial strains. Foxp3 was analyzed by GFP expression in D and IL-10 in E. (E) The percentage of IL-10+ cells within the CD4+Foxp3+ converted subset. These data are representative of two independent trials with at least three mice in each group.
Fig. 2.
Fig. 2.
PSA is sufficient to induce functional Foxp3+ Tregs with an inducible phenotype. (A) Foxp3-GFP mice were orally gavaged with purified PSA, MLNs harvested, and cells stained for CD4 and CD25. Each symbol represents the percent of CD4+ Foxp3-GFP+ cells from a single mouse. Results are representative of three independent trials with four mice per group. **P < 0.01. (B) CD4+CD25+ cells were purified from the MLNs of mice treated with either PBS or PSA, as indicated in A, and incubated with CFSE-pulsed CD4+CD25 effector T cells in an in vitro suppression assay. Numbers indicate the percentage of cells undergoing at least one cellular division at three different ratios of effector T cells (Teff) and Tregs. These data are representative of two independent trials. (C) Foxp3-GFP mice were orally treated with purified PSA. MLNs were extracted and CD4+Foxp3+ or the CD4+Foxp3 T cells were purified based on ±GFP expression (purity >99%). RNA was extracted and used for qRT-PCR. These data are representative of three independent experiments. Light bars indicated cells derived from PBS treated mice and dark bars from PSA-treated mice. (D) TLR2−/− mice were orally treated with PSA. MLNs were extracted and analyzed for the percentage of CD4+Foxp3+ cells. Each symbol in the bar graph represents the percentage of CD4+Foxp3+ from an individual mouse. NS, not significant. Results are representative of three independent trials with at least three mice per group. (E) CD4+CD25hi+ and CD4+CD25 T cell populations were FACS purified from MLNs of PSA-treated TLR2−/− mice. IL-10 levels were analyzed by qRT-PCR. Light and dark bars indicate IL-10 levels in PBS or PSA treated animals, respectively. Error bars represent the SD from samples of the same experiment run in triplicate. Results are representative of two independent trials with four mice per group.
Fig. 3.
Fig. 3.
PSA expands functional Foxp3+ Tregs during protection from experimental colitis. (A) BALB/c mice were treated with PSA or PBS during TNBS induced colitis and analyzed for the percentage of CD25+Foxp3+ cells within the CD4+ population of the MLN. These data are representative of three independent trials with four mice per group. (B) Mice were treated as in A, MLN cells were counted, and absolute numbers of CD4+CD25+Foxp3+ cells determined (×103). Numbers represent the average of four mice with error bars indicting SD, and are representative of three independent trials. (C) RNA was extracted from the MLNs of mice treated with PSA and foxp3 transcript expression is shown, normalized to β-actin expression in the total lymph node. Numbers represent the average of four mice, with error bars indicating SD, and are representative of three independent trials. (D) CD4+CD25+ cells were purified from the MLNs of colitic PBS or PSA-treated mice and incubated with CFSE-pulsed CD4+CD25 responder cells in an in vitro suppression assay. Numbers indicate the percentage of cells undergoing at least one cellular division at two different ratios of Teffs and Tregs. These data are representative of two independent trials. (E) C57BL/6 WT or TLR2−/− animals were gavaged with purified PSA (or PBS) before TNBS administration. Colons were fixed, sectioned, and H&E stained. Representative histological sections are shown. (F) Colitis scores show that PSA protects WT but not TLR2−/− animals from experimental colitis. Each symbol represents a separate animal, and data are from two independent trails. *P < 0.05. NS, not significant. (G) RNA was extracted from the MLNs of indicated mice either treated with PBS or PSA, and the expression levels of IL-10 and IL-17A were assayed by qRT-PCR. Relative units are represented as transcript levels relative to expression of a housekeeping gene (L32). Results are representative of three independent trials with four mice per group; error bars indicate SD. (H) Percentages of CD4+CD25+Foxp3+ T cells in the MLNs of TLR2−/− mice treated with PBS or PSA during TNBS induced colitis. Plots are gated on CD4+ T cells. Results are representative of three independent trials with four mice per group.
Fig. 4.
Fig. 4.
PSA treatment cures animals with colitis. (A) BALB/c mice were either pretreated with PSA before administration of 1% TNBS (pre) or orally treated with PSA 24 h after the administration of TNBS (post). Mice were weighed daily for 8 d. *P < 0.05 at the indicated time points. (B and C) Colons were extracted from groups of mice treated as in A, fixed, sectioned, and stained with H&E to determine disease severity 5 d post-TNBS administration. Representative sections are shown in B. Colitis scores are shown in C. Data are representative of three independent experiments, P values determined by a two-tailed Mann-Whitney U test. **P < 0.01. (D) MLNs from indicated mice were extracted and cells stained with antibodies to detect for CD4, CD25, and Foxp3. Numbers indicate the percentage of CD25+ Foxp3+ cells within CD4+ population of cells. Results are representative of three independent trials with four mice per group; error bars indicate SD. (E) BALB/c mice were treated with PSA as indicated in A and rectally administered 2% TNBS. Number of animals: 8 mice in the control group, 7 in the pre-TNBS PSA group, and 5 in the post-TNBS PSA groups, and 11 in the TNBS+PBS group. Data in E are the combination of two independent experiments.

Comment in

Similar articles

Cited by

References

    1. Turnbaugh PJ, et al. The human microbiome project. Nature. 2007;449:804–810. - PMC - PubMed
    1. Round JL, Mazmanian SK. The gut microbiota shapes intestinal immune responses during health and disease. Nat Rev Immunol. 2009;9:313–323. - PMC - PubMed
    1. Frank DN, et al. Molecular-phylogenetic characterization of microbial community imbalances in human inflammatory bowel diseases. Proc Natl Acad Sci USA. 2007;104:13780–13785. - PMC - PubMed
    1. Dong C. Diversification of T-helper-cell lineages: Finding the family root of IL-17-producing cells. Nat Rev Immunol. 2006;6:329–333. - PubMed
    1. Fontenot JD, et al. Regulatory T cell lineage specification by the forkhead transcription factor foxp3. Immunity. 2005;22:329–341. - PubMed

Publication types

MeSH terms