

Regulation of cell motile behavior by crosstalk between cadherin- and integrin-mediated adhesions
- PMID: 20566866
- PMCID: PMC2922157
- DOI: 10.1073/pnas.1002662107
Regulation of cell motile behavior by crosstalk between cadherin- and integrin-mediated adhesions
Abstract
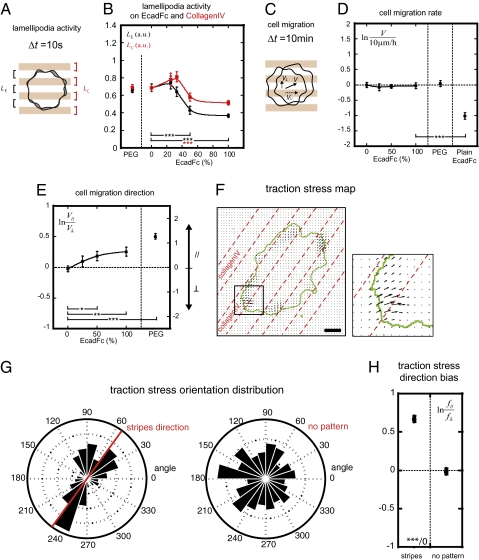
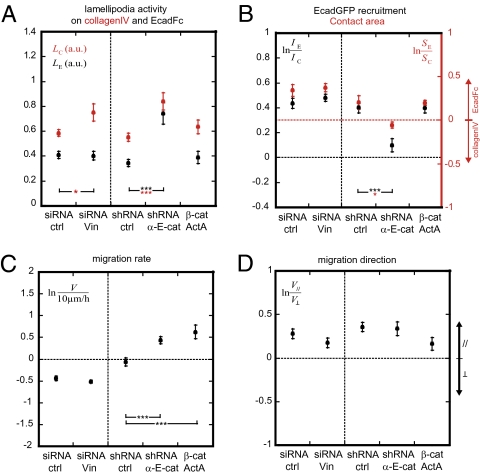
During normal development and in disease, cohesive tissues undergo rearrangements that require integration of signals from cell adhesions to neighboring cells and to the extracellular matrix (ECM). How a range of cell behaviors is coordinated by these different adhesion complexes is unknown. To analyze epithelial cell motile behavior in response to combinations of cell-ECM and cell-cell adhesion cues, we took a reductionist approach at the single-cell scale by using unique, functionalized micropatterned surfaces comprising alternating stripes of ECM (collagenIV) and adjustable amounts of E-cadherin-Fc (EcadFc). On these surfaces, individual cells spatially segregated integrin- and cadherin-based complexes between collagenIV and EcadFc surfaces, respectively. Cell migration required collagenIV and did not occur on surfaces functionalized with only EcadFc. However, E-cadherin adhesion dampened lamellipodia activity on both collagenIV and EcadFc surfaces and biased the direction of cell migration without affecting the migration rate, all in an EcadFc concentration-dependent manner. Traction force microscopy showed that spatial confinement of integrin-based adhesions to collagenIV stripes induced anisotropic cell traction on collagenIV and migration directional bias. Selective depletion of different pools of alphaE-catenin, an E-cadherin and actin binding protein, identified a membrane-associated pool required for E-cadherin-mediated adhesion and down-regulation of lamellipodia activity and a cytosolic pool that down-regulated the migration rate in an E-cadherin adhesion-independent manner. These results demonstrate that there is crosstalk between E-cadherin- and integrin-based adhesion complexes and that E-cadherin regulates lamellipodia activity and cell migration directionality, but not cell migration rate.
Conflict of interest statement
The authors declare no conflict of interest.
Figures


Comment in
-
Dissecting cell adhesion cross-talk with micropatterns.Proc Natl Acad Sci U S A. 2010 Jul 27;107(30):13199-200. doi: 10.1073/pnas.1008253107. Epub 2010 Jul 16. Proc Natl Acad Sci U S A. 2010. PMID: 20639470 Free PMC article. No abstract available.
Similar articles
-
AlphaE-catenin regulates actin dynamics independently of cadherin-mediated cell-cell adhesion.J Cell Biol. 2010 Apr 19;189(2):339-52. doi: 10.1083/jcb.200910041. J Cell Biol. 2010. PMID: 20404114 Free PMC article.
-
Dissecting cell adhesion cross-talk with micropatterns.Proc Natl Acad Sci U S A. 2010 Jul 27;107(30):13199-200. doi: 10.1073/pnas.1008253107. Epub 2010 Jul 16. Proc Natl Acad Sci U S A. 2010. PMID: 20639470 Free PMC article. No abstract available.
-
α-Catenin and vinculin cooperate to promote high E-cadherin-based adhesion strength.J Biol Chem. 2013 Feb 15;288(7):4957-69. doi: 10.1074/jbc.M112.403774. Epub 2012 Dec 24. J Biol Chem. 2013. PMID: 23266828 Free PMC article.
-
E-cadherin-integrin crosstalk in cancer invasion and metastasis.J Cell Sci. 2013 Jan 15;126(Pt 2):393-401. doi: 10.1242/jcs.100115. Epub 2013 Mar 22. J Cell Sci. 2013. PMID: 23525005 Review.
-
New insights into vinculin function and regulation.Int Rev Cell Mol Biol. 2011;287:191-231. doi: 10.1016/B978-0-12-386043-9.00005-0. Int Rev Cell Mol Biol. 2011. PMID: 21414589 Free PMC article. Review.
Cited by
-
Vinculin, cadherin mechanotransduction and homeostasis of cell-cell junctions.Protoplasma. 2013 Aug;250(4):817-29. doi: 10.1007/s00709-012-0475-6. Epub 2012 Dec 29. Protoplasma. 2013. PMID: 23274283 Review.
-
Molecular Crosstalk between Integrins and Cadherins: Do Reactive Oxygen Species Set the Talk?J Signal Transduct. 2012;2012:807682. doi: 10.1155/2012/807682. Epub 2011 Dec 13. J Signal Transduct. 2012. PMID: 22203898 Free PMC article.
-
DDR1 promotes E-cadherin stability via inhibition of integrin-β1-Src activation-mediated E-cadherin endocytosis.Sci Rep. 2016 Nov 8;6:36336. doi: 10.1038/srep36336. Sci Rep. 2016. PMID: 27824116 Free PMC article.
-
Tissue Regeneration from Mechanical Stretching of Cell-Cell Adhesion.Tissue Eng Part C Methods. 2019 Nov;25(11):631-640. doi: 10.1089/ten.TEC.2019.0098. Epub 2019 Sep 25. Tissue Eng Part C Methods. 2019. PMID: 31407627 Free PMC article. Review.
-
The secret life of α-catenin: moonlighting in morphogenesis.J Cell Biol. 2011 Nov 14;195(4):543-52. doi: 10.1083/jcb.201103106. J Cell Biol. 2011. PMID: 22084304 Free PMC article. Review.
References
-
- Wood W, et al. Wound healing recapitulates morphogenesis in Drosophila embryos. Nat Cell Biol. 2002;4:907–912. - PubMed
-
- Bertet C, Sulak L, Lecuit T. Myosin-dependent junction remodelling controls planar cell intercalation and axis elongation. Nature. 2004;429:667–671. - PubMed
-
- Duband JL, Monier F, Delannet M, Newgreen D. Epithelium-mesenchyme transition during neural crest development. Acta Anat (Basel) 1995;154:63–78. - PubMed
-
- Thiery JP. Epithelial-mesenchymal transitions in development and pathologies. Curr Opin Cell Biol. 2003;15:740–746. - PubMed
-
- Abercrombie M, Heaysman JE. Observations on the social behaviour of cells in tissue culture. II. Monolayering of fibroblasts. Exp Cell Res. 1954;6:293–306. - PubMed
Publication types
MeSH terms
Substances
Grants and funding
LinkOut - more resources
Full Text Sources
Other Literature Sources
Molecular Biology Databases
