. 2010 Jul 6;107(27):12323-8.
doi: 10.1073/pnas.1001745107. Epub 2010 Jun 21.

Disruption of the olivo-cerebellar circuit by Purkinje neuron-specific ablation of BK channels

Affiliations

Disruption of the olivo-cerebellar circuit by Purkinje neuron-specific ablation of BK channels

Xiaowei Chen et al. Proc Natl Acad Sci U S A. .

Abstract

The large-conductance voltage- and calcium-activated potassium (BK) channels are ubiquitously expressed in the brain and play an important role in the regulation of neuronal excitation. Previous work has shown that the total deletion of these channels causes an impaired motor behavior, consistent with a cerebellar dysfunction. Cellular analyses showed that a decrease in spike firing rate occurred in at least two types of cerebellar neurons, namely in Purkinje neurons (PNs) and in Golgi cells. To determine the relative role of PNs, we developed a cell-selective mouse mutant, which lacked functional BK channels exclusively in PNs. The behavioral analysis of these mice revealed clear symptoms of ataxia, indicating that the BK channels of PNs are of major importance for normal motor coordination. By using combined two-photon imaging and patch-clamp recordings in these mutant mice, we observed a unique type of synaptic dysfunction in vivo, namely a severe silencing of the climbing fiber-evoked complex spike activity. By performing targeted pharmacological manipulations combined with simultaneous patch-clamp recordings in PNs, we obtained direct evidence that this silencing of climbing fiber activity is due to a malfunction of the tripartite olivo-cerebellar feedback loop, consisting of the inhibitory synaptic connection of PNs to the deep cerebellar nuclei (DCN), followed by a projection of inhibitory DCN afferents to the inferior olive, the origin of climbing fibers. Taken together, our results establish an essential role of BK channels of PNs for both cerebellar motor coordination and feedback regulation in the olivo-cerebellar loop.


Conflict of interest statement

The authors declare no conflict of interest.

Figures

Fig. 1.
Fig. 1.
Impairments of motor coordination in both total BK−/− and PN-BK−/− mice. (A) Footprint patterns in WT and total BK−/− mice. Left: Mice walking on a glass plate. Their body diameters are indicated by dotted lines. Right: Summary of the superimposed paw positions of four WT and four total BK−/− mice. (B) Bar chart comparison of walking behavior in WT and total BK−/− mice. Left: Summary of A showing the percentage of hindpaw positions outside of the body diameter. Center: Percentage of hindpaw slips relative to the total number of steps on a ladder (n = 7 WT and 4 total BK−/− mice). Right: Percentage of hindpaw slips during running on a balance beam (n = 6 WT and 5 total BK−/− mice). (C) Footprint patterns in WT and PN-BK−/− mice. Right: Summary of the paw positions of 7 WT and PN-BK−/− mice. (D) Histograms indicate the percentage of hindpaw positions outside of the body diameter (Left: summary of the number of red dots in C), the percentage of hindpaw slips relative to the total number of steps on a ladder runway (Center) (n = 12 WT and 11 PN-BK−/− mice), and the percentage of hindpaw slips during running on a balance beam (Right) (n = 9 WT and 9 PN-BK−/− mice). Failure means in this case that the animals are not able to move forward on the beam but fall down. *P < 0.05. Error bars show SEM.
Fig. 2.
Fig. 2.
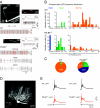
Silencing of CS activity in PN-BK−/− mice. (A) Cell-attached recording and Ca2+ imaging of CS activity. Projection images: an electroporated PN filled with Oregon Green BAPTA-1 (OGB-1) from a WT (upper two images) or PN-BK−/− (lower image) mouse. The xy image (Upper Right) is an optical section through the dendritic tree of the PN at the level marked by the dotted line in the xz image (Upper Left). Regions of interest are delineated by dotted red lines. Insets: Examples of individual CSs and the corresponding Ca2+ transients from a WT (Upper) or PN-BK−/− (Lower) cell. Electrical traces: one example of PN activity in a WT cell and three examples in PN-BK−/− cells. The latter represents the three classes of CS activity: silent (0–0.05 Hz), quiet (0.05–0.6 Hz), and normal (0.6–2.4 Hz). The SS and CS are labeled in gray and red, respectively. The continuous gray background reflects high frequency of SS activity. (B) Frequency distribution in the three classes of cells. (C) Pie charts summarize the relative proportion of PNs with silent, quiet, or normal climbing fiber activity (n = 34 WT cells and 57 PN-BK−/− cells; 10 mice for each genotype). (D) Image of a whole-cell patch-clamped PN and the location of the climbing fiber stimulation pipette (CF stim) in a cerebellar slice preparation. (E) Representative traces from two cells of each genotype, showing the characteristic CS waveforms elicited by stimulating the climbing fibers. Note the similarity of the responses (n = 5 WT and 10 PN-BK−/− cells).
Fig. 3.
Fig. 3.
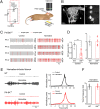
Rescue of CS activity in PN-BK−/− mice by harma-line. (A) Schematic presentation of the olivo-cerebellar circuit (Left) and the segment under examination (red dotted square) when harmaline was i.p. injected (Right). (B) xz and xy projection images of four electroporated PNs in a PN-BK−/− mouse. The pipette for cell-attached recording is indicated by dotted lines. (C) Representative traces recorded before and after harmaline injections from the four PN-BK−/− cells depicted in B. Note that the massive increase in CS activity was observed in all PNs in response to harmaline (20 mg/kg). (D) Summary of the mean CS frequency from both genotypes in the absence (Left) or presence (Right) of harmaline (Control: n = 7 cells in WT and 18 cells in PN-BK−/−; Harmaline: n = 13 cells in WT and 10 cells in PN-BK−/−; four WT and four PN-BK−/− mice). In the presence of harmaline, the CS frequency in PN-BK−/− mice was similar to that found in WT mice. (E) Harmaline-induced tremor in awake, freely moving WT (black) and PN-BK−/− (red) mice. Left: Representative tremor-induced force changes recorded by a pressure sensor before and after harmaline injection. Right: Normalized power spectra of the force measurements. The major, single peak around 10–15 Hz represents the frequency of harmaline-induced tremor. (F) Comparison of the tremor frequency shows no significant difference between WT (12.5 ± 0.5 Hz; n = 7) and PN-BK−/− (12.7 ± 0.5 Hz; n = 7) mice. ***P < 0.001. Error bars show SEM.
Fig. 4.
Fig. 4.
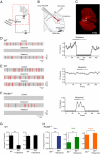
Rescue of CS activity in PN-BK−/− mice by increasing inhibition in the DCN. (A) Schematic presentation of the olivo-cerebellar circuit (Left) and the segment under examination (red dotted square) when gabazine or muscimol was locally applied to the DCN. (B) Experimental configuration for cell-attached recordings from PNs and local drug applications to the DCN. The glass pipette for drug application filled with Alexa594 was lowered from cortex into the DCN. (C) Fluorescence image showing the site of local drug application within the DCN (arrow). (D) Representative electrical traces and time-course of the effect of gabazine on CS activity in a WT cell. Gabazine (200 μM) applied into DCN dramatically reduced the frequency of CS. (E) Representative traces and time course showing the absence of effect of muscimol (300 μM) on the CS frequency in a WT mouse. (F) The CS activity was restored in a silent PN-BK−/− cell during application of muscimol into DCN. (G) Summary of D and E (n = 8 cells for gabazine experiments, n = 11 cells for muscimol experiments; paired t tests). (H) Summary of the effect of muscimol on three classes of CS activity in PN-BK−/− mice: silent (n = 7 cells), quiet (n = 7 cells), and normal (n = 5 cells) (paired t tests). *P < 0.05; **P < 0.01; ***P < 0.001. Error bars show SEM.

Similar articles

Cited by

References

    1. Faber ES, Sah P. Calcium-activated potassium channels: multiple contributions to neuronal function. Neuroscientist. 2003;9:181–194. - PubMed
    1. Sausbier M, et al. Cerebellar ataxia and Purkinje cell dysfunction caused by Ca2+-activated K+ channel deficiency. Proc Natl Acad Sci USA. 2004;101:9474–9478. - PMC - PubMed
    1. Sausbier U, et al. Ca2+ -activated K+ channels of the BK-type in the mouse brain. Histochem Cell Biol. 2006;125:725–741. - PubMed
    1. Womack MD, Hoang C, Khodakhah K. Large conductance calcium-activated potassium channels affect both spontaneous firing and intracellular calcium concentration in cerebellar Purkinje neurons. Neuroscience. 2009;162:989–1000. - PMC - PubMed
    1. Womack MD, Khodakhah K. Somatic and dendritic small-conductance calcium-activated potassium channels regulate the output of cerebellar Purkinje neurons. J Neurosci. 2003;23:2600–2607. - PMC - PubMed

Publication types

MeSH terms