. 2010 Jun 17;5(6):e11129.
doi: 10.1371/journal.pone.0011129.

Neural processing of short-term recurrence in songbird vocal communication

Affiliations

Neural processing of short-term recurrence in songbird vocal communication

Gabriël J L Beckers et al. PLoS One. .

Abstract

Background: Many situations involving animal communication are dominated by recurring, stereotyped signals. How do receivers optimally distinguish between frequently recurring signals and novel ones? Cortical auditory systems are known to be pre-attentively sensitive to short-term delivery statistics of artificial stimuli, but it is unknown if this phenomenon extends to the level of behaviorally relevant delivery patterns, such as those used during communication.

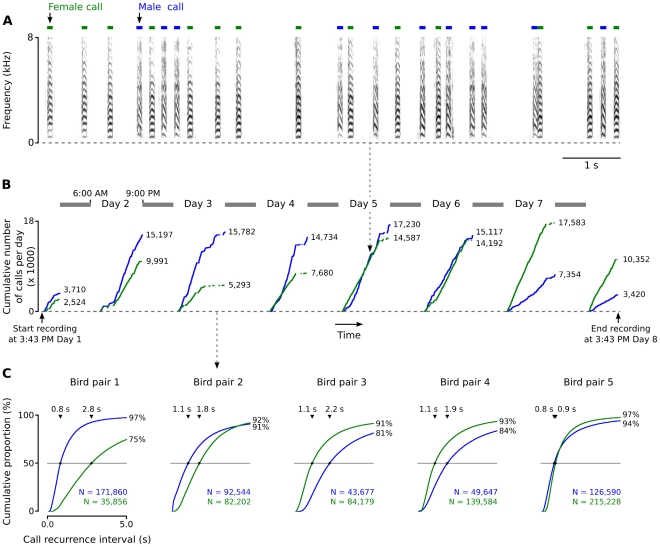
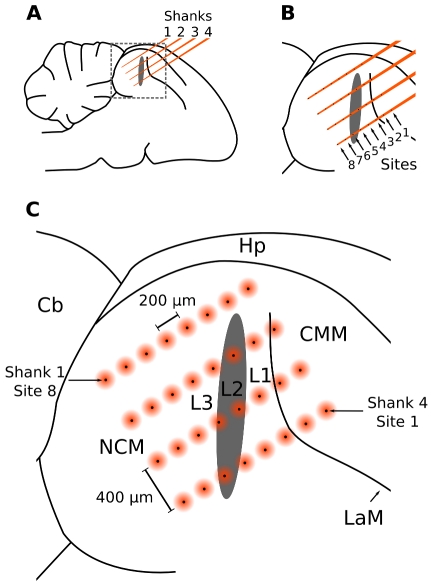
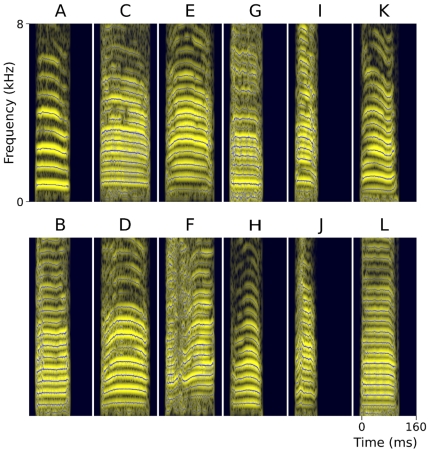
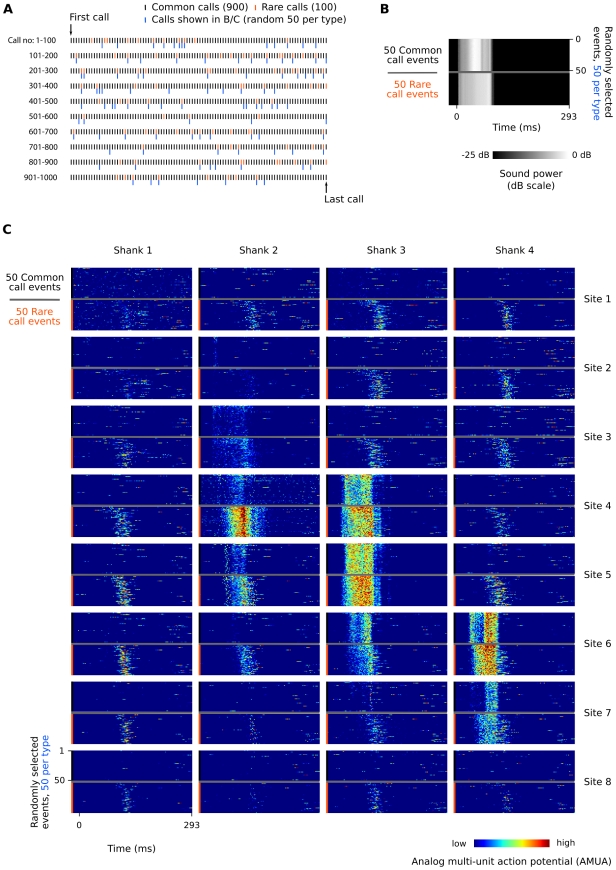
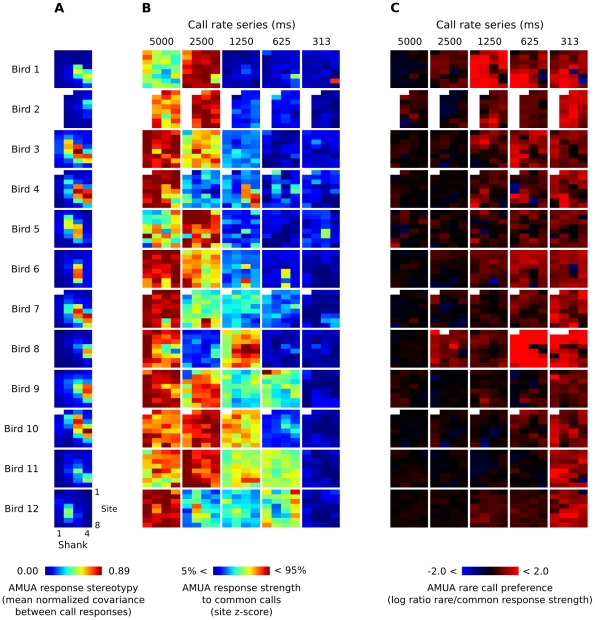
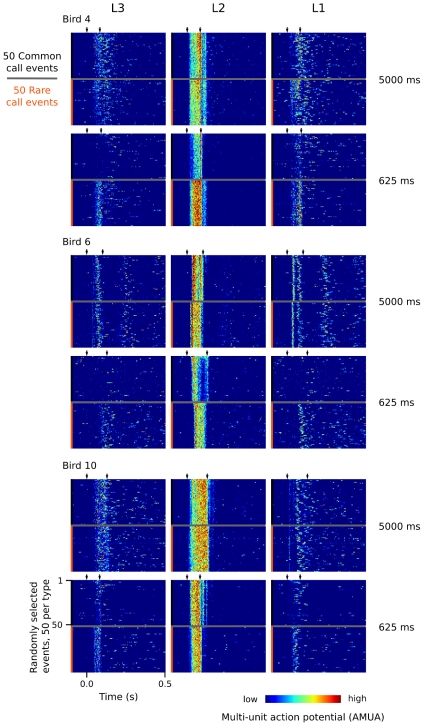
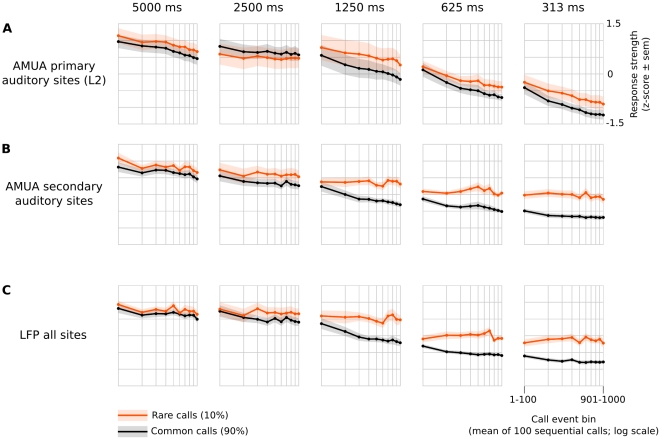
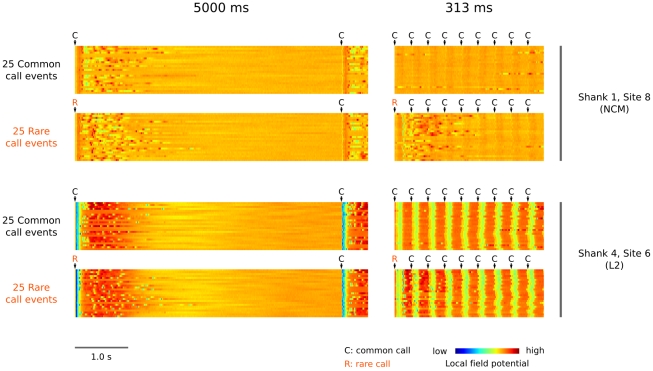
Methodology/principal findings: We recorded and analyzed complete auditory scenes of spontaneously communicating zebra finch (Taeniopygia guttata) pairs over a week-long period, and show that they can produce tens of thousands of short-range contact calls per day. Individual calls recur at time scales (median interval 1.5 s) matching those at which mammalian sensory systems are sensitive to recent stimulus history. Next, we presented to anesthetized birds sequences of frequently recurring calls interspersed with rare ones, and recorded, in parallel, action and local field potential responses in the medio-caudal auditory forebrain at 32 unique sites. Variation in call recurrence rate over natural ranges leads to widespread and significant modulation in strength of neural responses. Such modulation is highly call-specific in secondary auditory areas, but not in the main thalamo-recipient, primary auditory area.

Conclusions/significance: Our results support the hypothesis that pre-attentive neural sensitivity to short-term stimulus recurrence is involved in the analysis of auditory scenes at the level of delivery patterns of meaningful sounds. This may enable birds to efficiently and automatically distinguish frequently recurring vocalizations from other events in their auditory scene.


Conflict of interest statement

Competing Interests: The authors have declared that no competing interests exist.

Figures

Figure 1
Figure 1. Short-range contact call delivery by a male–female pair of zebra finches.
(A) A 10-s example of a communication scene. Green and blue bars indicate female and male calls respectively. (B) A mass-evolution graph shows the cumulative number of calls per individual per day, against occurrence in time. Shown is one pair of birds (pair 2 in C). Shaded bars indicate night-time. (C) Cumulative distributions of the duration between two sequential short-range contact calls from one individual (‘call recurrence interval’) for all five pairs measured in this study. Triangular markers indicate the location and value of the median call interval for a specific bird.
Figure 2
Figure 2. Schematic representation of the silicon multi-electrode array situated inside the auditory forebrain.
(A) The four equidistant and parallel shanks of the array are situated in a parasagittal plane in the medio-caudal forebrain. (B) Each shank contains eight electrodes (‘sites’). (C) The matrix of 32 sites cover a relatively large area from which neural responses can be recorded in parallel, including the anatomical Field L, consisting of subfields L1, L2, and L3, and NCM and CMM. The black spots represent electrode sites, while the orange circles indicate that recorded potentials may originate from a field around these sites. Hp: Hippocampus, Cb: Cerebellum, NCM: caudomedial nidopallium, CMM: caudomedial mesopallium, L1, L2, L3: subdivisions of Field L; LaM, lamina mesopallialis , .
Figure 3
Figure 3. Spectrographic representation of the 12 male zebra-finch short-range contact calls used as stimuli in this study.
Calls presented in columns are matched for duration. Shown are spectrograms (light bands) that have been calculated with a short-time Fourier transform, superimposed with a reassignment-based sparse time-frequency representation (dark lines; settings: 23 ms Gaussian analysis window, consensus of σ range 0.8–3.5, 0.25 ms step duration, 25 dB dynamic range; [55]). Call parameters (duration/mean fundamental frequency): A: 89 ms/784 Hz, B: 89 ms/528 Hz, C: 128 ms/452 Hz, D: 128 ms/591 Hz, E: 127 ms/551 Hz, F: 127 ms/433 Hz, G: 83 ms/413 Hz, H: 83 ms/570 Hz, I: 57 ms/470 Hz, J: 57 ms/530 Hz, K: 101 ms/564 Hz, L: 101 ms/470 Hz. Fundamental frequency was determined with an autocorrelation algorithm .
Figure 4
Figure 4. Example of AMUA responses to common and rare calls in the 625 ms sequence (Bird 3, calls K and L, respectively).
(A) Common calls (900, black marks) are randomly interspersed with rare calls (100, orange marks). Blue marks indicate the 100 calls (50 per type) that have been randomly selected to be shown in subfigures B and C. (B) Call stimuli are recorded synchronously with the electrophysiological signals to verify correct alignment of measurement episodes in our analyses. (C) Raster plots of AMUA signals in response to randomly selected sets of 50 common calls and 50 rare calls. Common and rare calls are shown separately although they have been presented to the bird in a random mixture (see A). Color represents AMUA amplitude, scaled per site, and clipped to 25% and 75% of the total signal range for visual presentation only.
Figure 5
Figure 5. AMUA response measures for all sites from which we recorded in this study.
Each of the 32-pixel colored square corresponds to the matrix of 4×8 sites of a multi-electrode array that was used for simultaneous recordings (see Figure 2). (A) Response stereotypy for each electrode site in each bird, based on responses to both common and rare calls in all six sequences. Sites with a relatively high response stereotypy correspond to the anatomical area L2. In four birds one or more sites are lacking, because they did not show auditory AMUA responses. (B) Modulation of response strength to common calls between call series with different recurrence rates. Response strength has been normalized to a z-score per site; color differences between sites are thus meaningless. Scores outside the 5–95% range have been clipped for visual presentation. Note that for each series birds received different calls, which may explain part of the variation in response strength. (C) Rare call preference, calculated as the log of the ratio between mean response strength to rare and common calls within one series. A score of 0 (black sites) indicates no preference, while negative scores (blue sites) indicate a common call preference and positive scores (red sites) indicate a rare call preference. Scores have been clipped to range between −2 and 2 for visual presentation.
Figure 6
Figure 6. Examples of response patterns to a random 50 common and a random 50 rare calls in three different birds for two different rate sequences.
For each bird and rate sequence, the responses of three sites are shown: the middle column shows that of a L2 site, while the first and last column show that of adjacent L3 and L1 sites, which are situated caudal and rostral to L2, respectively. The sites (shank, site) shown are: Bird 4 (2,6), (3,5), (4,4), Bird 6: (2,6), (3,4), (4,5), Bird 10: (3,8), (4,5), (4,3). Color represents AMUA amplitude, scaled per site, and clipped to 25% and 75% of the total signal range for visual presentation only.
Figure 7
Figure 7. Response strengths decrease with calling rate and are partly stimulus-specific.
The responses are standardized (z-scores), but note that all statistical tests in this study are based on absolute response levels. Shown are the mean of these values over birds (± standard error of the mean as shaded color), binned per 100 sequential call events and split between common and rare calls. (A) Mean (N = 9 birds) AMUA response strength at primary auditory sites. These sites have been classified as ‘primary’ based on their stimulus-locked, stereotypic response characteristics only; such sites cluster in a shape that corresponds to the anatomical area L2. (B) Mean (N = 12 birds) AMUA response strength at secondary auditory sites, i.e. sites whose auditory responses are not stereotypic responses and that surround L2 (i.e. L1, L3, NCM and CMM). (C) Mean (N = 9 birds) LFP response strength, which is not split between primary and secondary sites because local field potentials may not originate from the immediate vicinity of the site at which they are recorded.
Figure 8
Figure 8. Call-event related responses can last for a long time after a call has finished and responses of calls may overlap.
This is shown here using an example of LFP recordings in bird 1 at two different sites (NCM: top two rows, L2 bottom two rows) and two different recurrence rates (left column: 5000 ms series, right column 313 ms series). In the slow 5000 ms series, LFP responses to both common calls (random 25 events) and rare calls (random 25 events) can be seen to last up to seconds after the call event in both brain areas. In the fast 313 ms series, responses to common calls in the NCM site are almost completely absent, while those to rare calls are still visible. In the L2 site, responses to common calls have not disappeared but are clearly reduced. Importantly, in the 313 ms rate series responses to rare calls can be seen to continue during the presentation of a sequence of four subsequent common calls. Note that the actual common and odd call stimuli in the 5000 ms and 313 ms series are different (I/J and C/D of Figure 3, respectively). The jitter that is visible in the responses in L2 to subsequent calls, relative to the first one, is due to a small amount of deterministic jitter that we applied to the delivery of stimuli (see Materials and Methods).

References

    1. Barlow H. Possible principles underlying the transformations of sensory messages. In: Rosenblith W, editor. Sensory Communication. Cambridge, Massachusetts: MIT Press; 1961. pp. 182–192.
    1. Müller JR, Metha AB, Krauskopf J, Lennie P. Rapid adaptation in visual cortex to the structure of images. Science. 1999;285:1405–1408. - PubMed
    1. Ulanovsky N, Las L, Nelken I. Processing of low-probability sounds by cortical neurons. Nat Neurosci. 2003;6:391–398. - PubMed
    1. Näätänen R, Tervaniemi M, Sussman E, Paavilainen P, Winkler I. ‘Primitive intelligence’ in the auditory cortex. Trends Neurosci. 2001;24:283–288. - PubMed
    1. Nelken I, Ulanovsky N. Mismatch negativity and stimulus-specific adaptation in animal models. J Psychophysiol. 2007;21:214–223.

Publication types