

Genetic control of lithium sensitivity and regulation of inositol biosynthetic genes
- PMID: 20567601
- PMCID: PMC2887444
- DOI: 10.1371/journal.pone.0011151
Genetic control of lithium sensitivity and regulation of inositol biosynthetic genes
Abstract
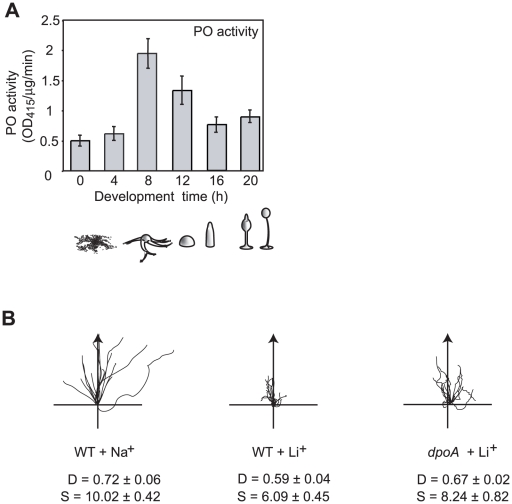
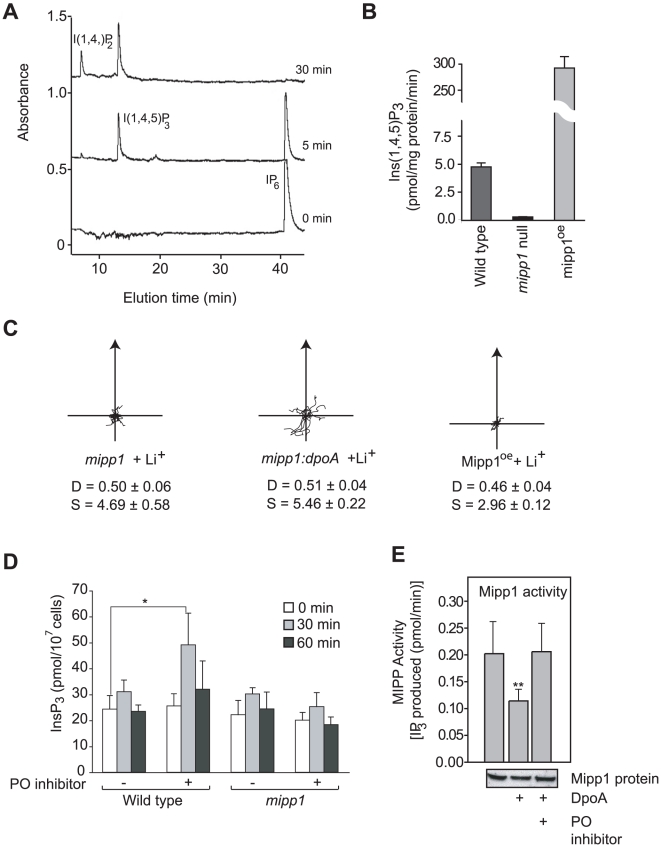
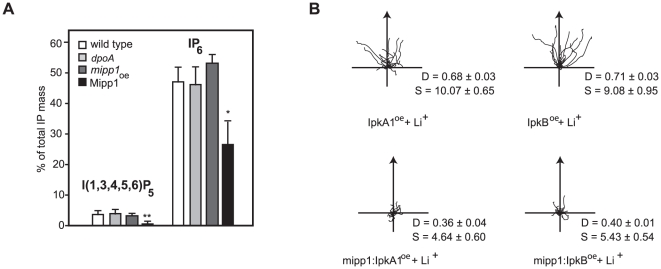
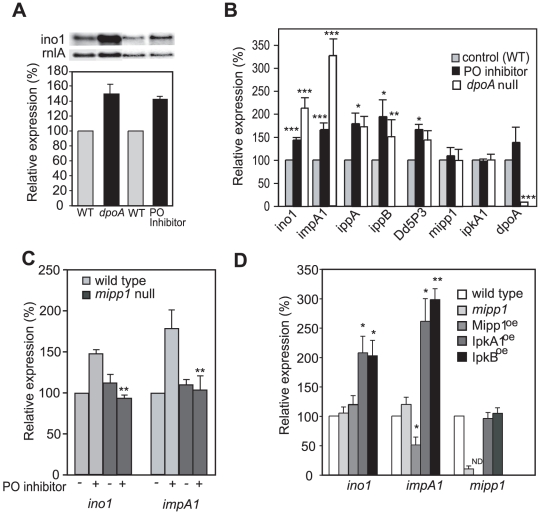
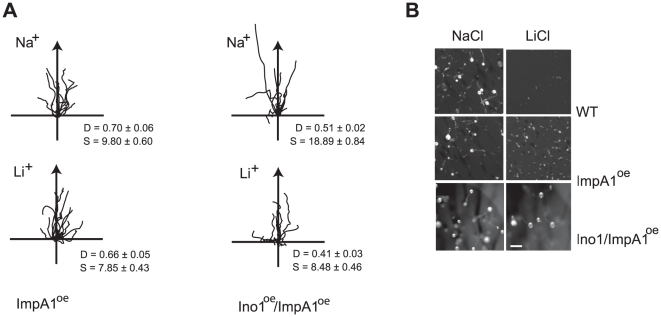
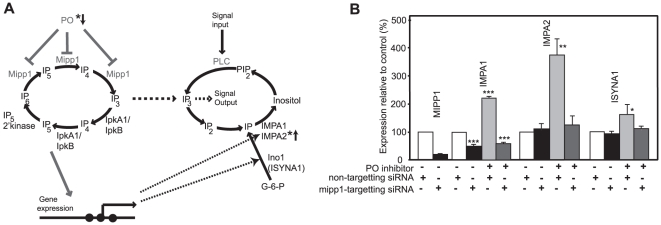
Lithium (Li(+)) is a common treatment for bipolar mood disorder, a major psychiatric illness with a lifetime prevalence of more than 1%. Risk of bipolar disorder is heavily influenced by genetic predisposition, but is a complex genetic trait and, to date, genetic studies have provided little insight into its molecular origins. An alternative approach is to investigate the genetics of Li(+) sensitivity. Using the social amoeba Dictyostelium, we previously identified prolyl oligopeptidase (PO) as a modulator of Li(+) sensitivity. In a link to the clinic, PO enzyme activity is altered in bipolar disorder patients. Further studies demonstrated that PO is a negative regulator of inositol(1,4,5)trisphosphate (IP(3)) synthesis, a Li(+) sensitive intracellular signal. However, it was unclear how PO could influence either Li(+) sensitivity or risk of bipolar disorder. Here we show that in both Dictyostelium and cultured human cells PO acts via Multiple Inositol Polyphosphate Phosphatase (Mipp1) to control gene expression. This reveals a novel, gene regulatory network that modulates inositol metabolism and Li(+) sensitivity. Among its targets is the inositol monophosphatase gene IMPA2, which has also been associated with risk of bipolar disorder in some family studies, and our observations offer a cellular signalling pathway in which PO activity and IMPA2 gene expression converge.
Conflict of interest statement
Figures
Similar articles
-
Prolyl oligopeptidase, inositol phosphate signalling and lithium sensitivity.CNS Neurol Disord Drug Targets. 2011 May;10(3):333-9. doi: 10.2174/187152711794653779. CNS Neurol Disord Drug Targets. 2011. PMID: 21222625 Free PMC article. Review.
-
A promoter haplotype of the inositol monophosphatase 2 gene (IMPA2) at 18p11.2 confers a possible risk for bipolar disorder by enhancing transcription.Neuropsychopharmacology. 2007 Aug;32(8):1727-37. doi: 10.1038/sj.npp.1301307. Epub 2007 Jan 24. Neuropsychopharmacology. 2007. PMID: 17251911
-
Loss of a prolyl oligopeptidase confers resistance to lithium by elevation of inositol (1,4,5) trisphosphate.EMBO J. 1999 May 17;18(10):2734-45. doi: 10.1093/emboj/18.10.2734. EMBO J. 1999. PMID: 10329620 Free PMC article.
-
PtdIns(3,4,5)P(3) and inositol depletion as a cellular target of mood stabilizers.Biochem Soc Trans. 2009 Oct;37(Pt 5):1110-4. doi: 10.1042/BST0371110. Biochem Soc Trans. 2009. PMID: 19754462
-
Lithium pharmacodynamics and pharmacogenetics: focus on inositol mono phosphatase (IMPase), inositol poliphosphatase (IPPase) and glycogen sinthase kinase 3 beta (GSK-3 beta).Curr Med Chem. 2009;16(15):1917-48. doi: 10.2174/092986709788186101. Curr Med Chem. 2009. PMID: 19442155 Review.
Cited by
-
Extracellular Mipp1 Activity Confers Migratory Advantage to Epithelial Cells during Collective Migration.Cell Rep. 2015 Dec 15;13(10):2174-88. doi: 10.1016/j.celrep.2015.10.071. Epub 2015 Nov 25. Cell Rep. 2015. PMID: 26628373 Free PMC article.
-
Increasing phosphatidylinositol (4,5) bisphosphate biosynthesis affects plant nuclear lipids and nuclear functions.Plant Physiol Biochem. 2012 Aug;57:32-44. doi: 10.1016/j.plaphy.2012.05.011. Epub 2012 May 17. Plant Physiol Biochem. 2012. PMID: 22677448 Free PMC article.
-
Molecular pharmacology in a simple model system: implicating MAP kinase and phosphoinositide signalling in bipolar disorder.Semin Cell Dev Biol. 2011 Feb;22(1):105-13. doi: 10.1016/j.semcdb.2010.11.002. Epub 2010 Nov 18. Semin Cell Dev Biol. 2011. PMID: 21093602 Free PMC article. Review.
-
Simultaneous HPLC determination of soluble signaling molecules and metabolic status in neuroblastoma cell cultures.Physiol Rep. 2025 Jun;13(12):e70419. doi: 10.14814/phy2.70419. Physiol Rep. 2025. PMID: 40538078 Free PMC article.
-
Role of epigenetics in unicellular to multicellular transition in Dictyostelium.Genome Biol. 2021 May 4;22(1):134. doi: 10.1186/s13059-021-02360-9. Genome Biol. 2021. PMID: 33947439 Free PMC article.
References
-
- Craddock N, Sklar P. Genetics of bipolar disorder: successful start to a long journey. Trends Genet. 2009;25:99–105. - PubMed
-
- Taylor L, Faraone SV, Tsuang MT. Family, twin, and adoption studies of bipolar disease. Curr Psychiatry Rep. 2002;4:130–133. - PubMed
-
- Padmos RC, Van Baal GC, Vonk R, Wijkhuijs AJ, Kahn RS, et al. Genetic and environmental influences on pro-inflammatory monocytes in bipolar disorder: a twin study. Arch Gen Psychiatry. 2009;66:957–965. - PubMed
-
- Alloy LB, Abramson LY, Urosevic S, Walshaw PD, Nusslock R, et al. The psychosocial context of bipolar disorder: environmental, cognitive, and developmental risk factors. Clin Psychol Rev. 2005;25:1043–1075. - PubMed
-
- Burgess S, Geddes J, Hawton K, Townsend E, Jamison K, et al. Lithium for maintenance treatment of mood disorders. Cochrane Database Syst Rev. 2001. CD003013 - PubMed
