. 2010 May 25;7(3):110-9.
doi: 10.7150/ijms.7.110.

Parvovirus B19 genotype specific amino acid substitution in NS1 reduces the protein's cytotoxicity in culture

Affiliations

Parvovirus B19 genotype specific amino acid substitution in NS1 reduces the protein's cytotoxicity in culture

Violetta Kivovich et al. Int J Med Sci. .

Abstract

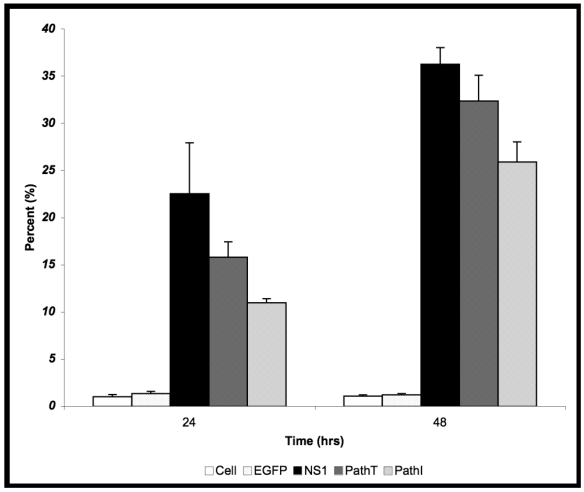
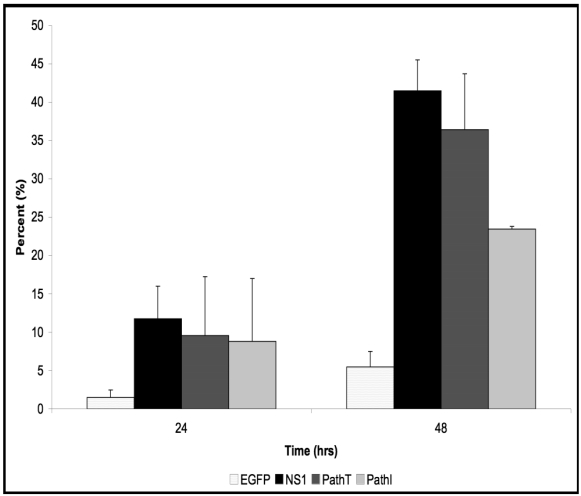
A clinical association between idiopathic liver disease and parvovirus B19 infection has been observed. Fulminant liver failure, not associated with other liver-tropic viruses, has been attributed to B19 in numerous reports, suggesting a possible role for B19 components in the extensive hepatocyte cytotoxicity observed in this condition. A recent report by Abe and colleagues (Int J Med Sci. 2007;4:105-9) demonstrated a link between persistent parvovirus B19 genotype I and III infection and fulminant liver failure. The genetic analysis of isolates obtained from these patients demonstrated a conservation of key amino acids in the nonstructural protein 1 (NS1) of the disease-associated genotypes. In this report we examine a conserved residue identified by Abe and colleagues and show that substitution of isoleucine 181 for methionine, as occurs in B19 genotype II, results in the reduction of B19 NS1-induced cytotoxicity of liver cells. Our results support the hypothesis that in the setting of persistent B19 infection, direct B19 NS1-induced cytotoxicity may play a role in idiopathic fulminant liver failure.

Keywords: Apoptosis; B19; Cytotoxicity; Fulminant Liver Failure; Parvovirus.


Conflict of interest statement

Conflict of Interest: The authors have declared that no conflict of interest exists.

Figures

Figure 1
Figure 1
Cytotoxicity Assay. HepG2 cells were mock, EGFP-, NS1-, PathT-, or PathI- transduced, collected at indicated times post-transduction and analyzed by trypan blue exclusion. The data represent the mean of three independent experiments demonstrating the percentage of total cells in the sample permeable to trypan blue uptake. One star (*) - statistically significant (p < 0.05) change between Cell and marked set. Two stars (**) - statistically significant (p< 0.05) change between NS1 and marked set. Bars demonstrate the standard deviation between individual runs.
Figure 2
Figure 2
AnnexinV Binding Assay. HepG2 cells were mock, EGFP-, NS1-, PathT-, or PathI-transduced, collected at indicated times post-transduction, and analyzed by flow cytometry for AnnexinV binding. Graphic representation of the means of three independent experiments, demonstrating the percentage of EGFP or EGFP-fusion protein expressing HepG2 cells that bind AnnexinV-PE, as identified by flow cytometry analysis. The AnnexinV results have been normalized for background AnnexinV-PE binding using mock-transduced cells. Bars demonstrate the standard deviation between individual runs. One star (*) - statistically significant (p < 0.05) change between Cell and marked set. Two stars (**) - statistically significant (p< 0.05) change between NS1 and marked set.
Figure 3
Figure 3
Cell Cycle Analysis for SubG1 Content. (A) Representative fluorescence intensity plots for propidium iodide emission demonstrating the cell cycle distribution of mock-transduced control (top) and NS1 (bottom) expressing HepG2 cells at 24 and 48 hrs post-transduction. (B) Quantitative graphic representation of HepG2 cell cycle distribution for mock, NS1, PathT and PathI in the SubG1 phase of the cell cycle. The data represents at least two independent experiments with bars demonstrating the standard deviation between the individual runs. One star (*) indicates statistically significant (p < 0.05) change between Cell and marked set. Two stars (**) - statistically significant (p< 0.05) change between NS1 and marked set. Three stars (***) - statistically significant (p< 0.05) change between PathT and marked set.

Similar articles

Cited by

References

    1. Abe K, Kiuchi T, Tanaka K, Edamoto Y, Aiba N, Sata T. Characterization of erythrovirus B19 genomes isolated in liver tissues from patients with fulminant hepatitis and biliary atresia who underwent liver transplantation. Int J Med Sci. 2007;4:105–9. - PMC - PubMed
    1. Anderson M.J, Higgins PG, Davis LR, Willman JS, Jones SE, Kidd IM, Pattison JR, Tyrrell DA. Experimental parvoviral infection in humans. J Infect Dis. 1985;152:257–65. - PubMed
    1. Bonvicini F, Filippone C, Manaresi E, Zerbini M, Musiani M, Gallinella G. HepG2 hepatocellular carcinoma cells are a non-permissive system for B19 virus infection. J Gen Virol. 2008;89:3034–8. - PubMed
    1. Brown K.E, Anderson SM, Young NS. Erythrocyte P antigen: cellular receptor for B19 parvovirus. Science. 1993;262:114–7. - PubMed
    1. Brunstein J, Soderlund-Venermo M, Hedman K. Identification of a novel RNA splicing pattern as a basis of restricted cell tropism of erythrovirus B19. Virology. 2000;274:284–91. - PubMed

Substances