

GPCR kinase 2 interacting protein 1 (GIT1) regulates osteoclast function and bone mass
- PMID: 20568227
- PMCID: PMC2939960
- DOI: 10.1002/jcp.22282
GPCR kinase 2 interacting protein 1 (GIT1) regulates osteoclast function and bone mass
Abstract
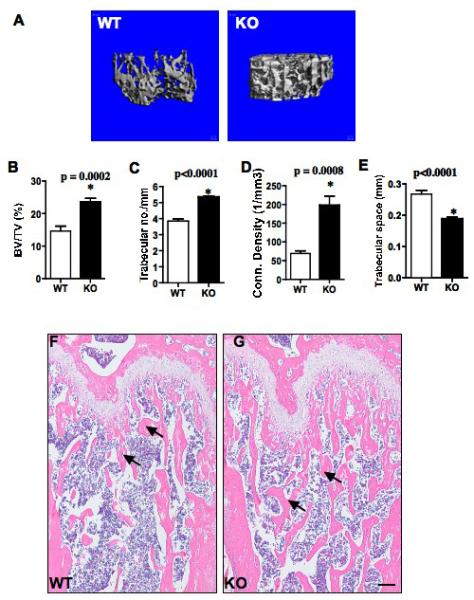
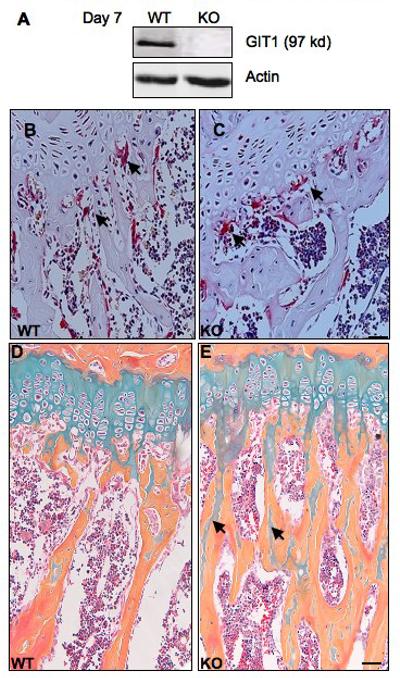
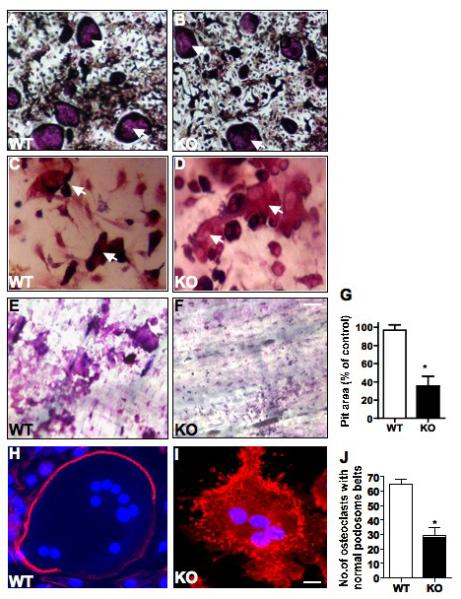
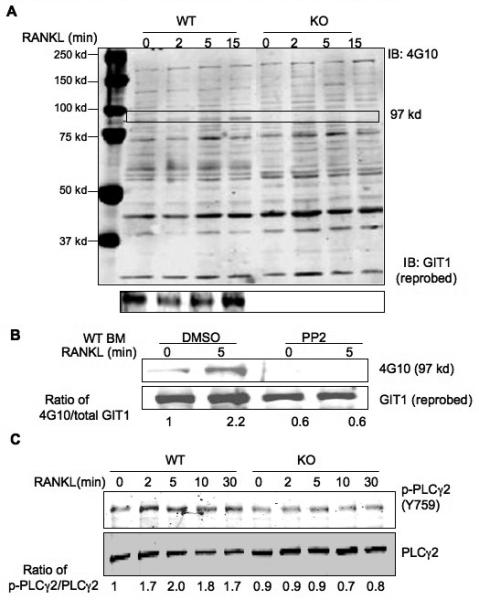
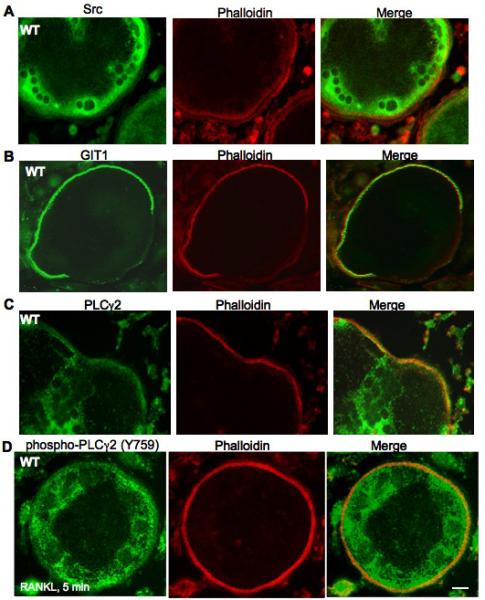
G-protein-coupled receptor (GPCR) kinase 2 interacting protein-1 (GIT1) is a scaffold protein expressed in various cell types including neurons, endothelial, and vascular smooth muscle cells. The GIT1 knockout (KO) mouse has a pulmonary phenotype due to impaired endothelial function. Because GIT1 is tyrosine phosphorylated by Src kinase, we anticipated that GIT1 KO should have a bone phenotype similar to Src KO. Microcomputed tomography of the long bones revealed that GIT1 KO mice have a 2.3-fold increase in bone mass compared to wild-type controls. Histomorphometry showed increased trabecular number and connectivity suggesting impaired bone remodeling. Immunoblot analysis of GIT1 expression showed that it was expressed in both osteoclasts and osteoblasts. Osteoblast activity and function assayed by alkaline phosphatase, mineral nodule formation, and in vivo calcein labeling were normal in GIT1 KO mice suggesting that the observed increase in bone mass was due to an osteoclast defect. GIT1 KO bone marrow cells differentiated into multinucleated osteoclasts, but had defective bone resorbing function on dentin slices. This defect was likely caused by loss of podosome belt based on immunofluorescence analysis and previous studies showing that GIT1 is required for podosome formation. Furthermore, we found that GIT1 was a regulator of receptor activator of NFκB (RANK) signaling since it was tyrosine phosphorylated in a Src-dependent manner and was required for phospholipase C-γ2 phosphorylation. These data show that GIT1 is a key regulator of bone mass in vivo by regulating osteoclast function and suggest GIT1 as a potential target for osteoporosis therapy.
© 2010 Wiley-Liss, Inc.
Figures
Similar articles
-
Impaired angiogenesis during fracture healing in GPCR kinase 2 interacting protein-1 (GIT1) knock out mice.PLoS One. 2014 Feb 19;9(2):e89127. doi: 10.1371/journal.pone.0089127. eCollection 2014. PLoS One. 2014. PMID: 24586541 Free PMC article.
-
GIT1 is critical for formation of the CD31hiEmcnhi vessel subtype in coupling osteogenesis with angiogenesis via modulating preosteoclasts secretion of PDGF-BB.Bone. 2019 May;122:218-230. doi: 10.1016/j.bone.2019.03.006. Epub 2019 Mar 7. Bone. 2019. PMID: 30853660
-
Phosphorylation of G protein-coupled receptor kinase 2-interacting protein 1 tyrosine 392 is required for phospholipase C-gamma activation and podosome formation in vascular smooth muscle cells.Arterioscler Thromb Vasc Biol. 2010 Oct;30(10):1976-82. doi: 10.1161/ATVBAHA.110.212415. Epub 2010 Aug 5. Arterioscler Thromb Vasc Biol. 2010. PMID: 20689073 Free PMC article.
-
Tyrosine Kinase Src Is a Regulatory Factor of Bone Homeostasis.Int J Mol Sci. 2022 May 14;23(10):5508. doi: 10.3390/ijms23105508. Int J Mol Sci. 2022. PMID: 35628319 Free PMC article. Review.
-
The unique function of p130Cas in regulating the bone metabolism.Pharmacol Ther. 2022 Feb;230:107965. doi: 10.1016/j.pharmthera.2021.107965. Epub 2021 Aug 12. Pharmacol Ther. 2022. PMID: 34391790 Review.
Cited by
-
GIT1 regulates angiogenic factor secretion in bone marrow mesenchymal stem cells via NF-κB/Notch signalling to promote angiogenesis.Cell Prolif. 2019 Nov;52(6):e12689. doi: 10.1111/cpr.12689. Epub 2019 Sep 10. Cell Prolif. 2019. PMID: 31502302 Free PMC article.
-
GIT1 contributes to autophagy in osteoclast through disruption of the binding of Beclin1 and Bcl2 under starvation condition.Cell Death Dis. 2018 Dec 13;9(12):1195. doi: 10.1038/s41419-018-1256-8. Cell Death Dis. 2018. PMID: 30546041 Free PMC article.
-
Dendronized chitosan hydrogel with GIT1 to accelerate bone defect repair through increasing local neovascular amount.Bone Rep. 2023 Aug 30;19:101712. doi: 10.1016/j.bonr.2023.101712. eCollection 2023 Dec. Bone Rep. 2023. PMID: 37744736 Free PMC article.
-
The regulation of osteoclast function and bone resorption by small GTPases.Small GTPases. 2011 May;2(3):117-130. doi: 10.4161/sgtp.2.3.16453. Small GTPases. 2011. PMID: 21776413 Free PMC article.
-
Transferrin receptor 1-mediated iron uptake regulates bone mass in mice via osteoclast mitochondria and cytoskeleton.Elife. 2022 Jun 27;11:e73539. doi: 10.7554/eLife.73539. Elife. 2022. PMID: 35758636 Free PMC article.
References
-
- Armstrong A, Tometsko M, Glaccum M, Sutherland C, Cosman D, Dougall W. A RANK/TRAF6-dependent signal transduction pathway is essential for osteoclast cytoskeletal organization and resorptive function. J Biol Chem. 2002;277:44347–44356. - PubMed
-
- Boyle WJSW, LAcey DL. Osteoclast differentiation and activation. Nature. 2003;423:37–42. - PubMed
Publication types
MeSH terms
Substances
Grants and funding
LinkOut - more resources
Full Text Sources
Medical
Molecular Biology Databases
Research Materials
Miscellaneous
