

Cation selectivity by the CorA Mg2+ channel requires a fully hydrated cation
- PMID: 20568735
- PMCID: PMC2912426
- DOI: 10.1021/bi1005656
Cation selectivity by the CorA Mg2+ channel requires a fully hydrated cation
Abstract
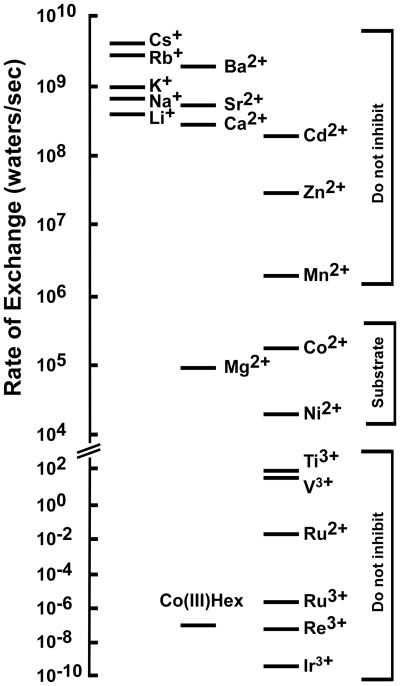
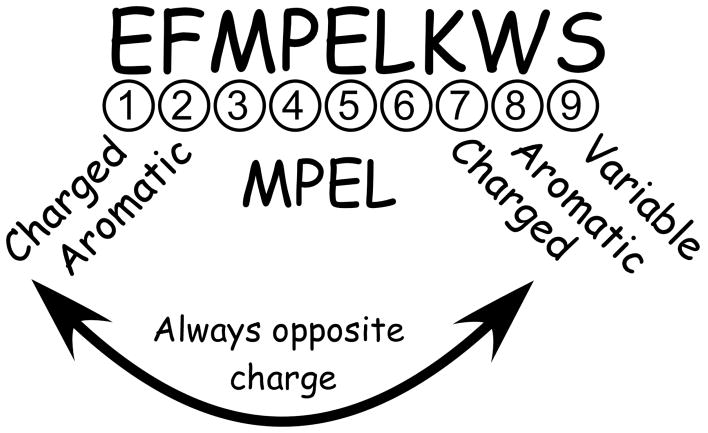
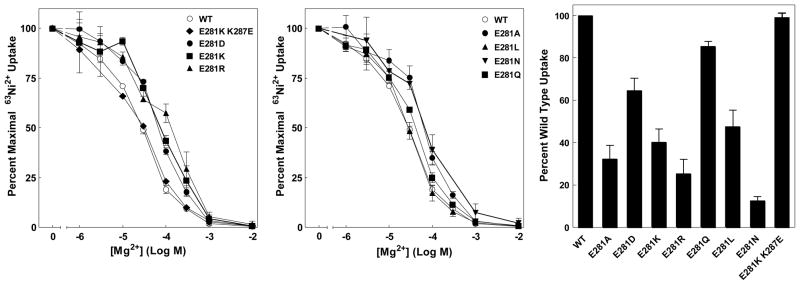
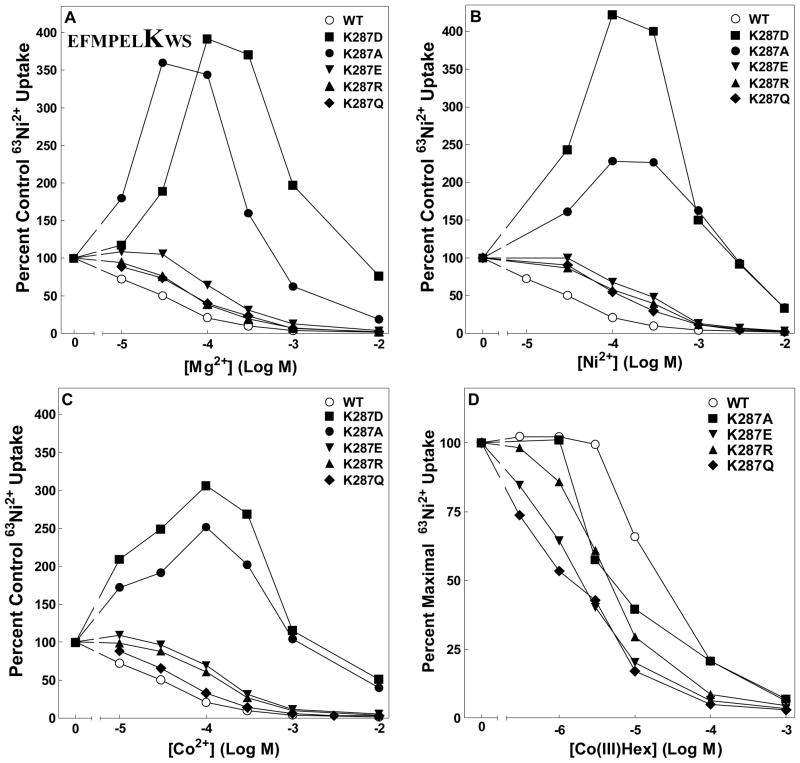
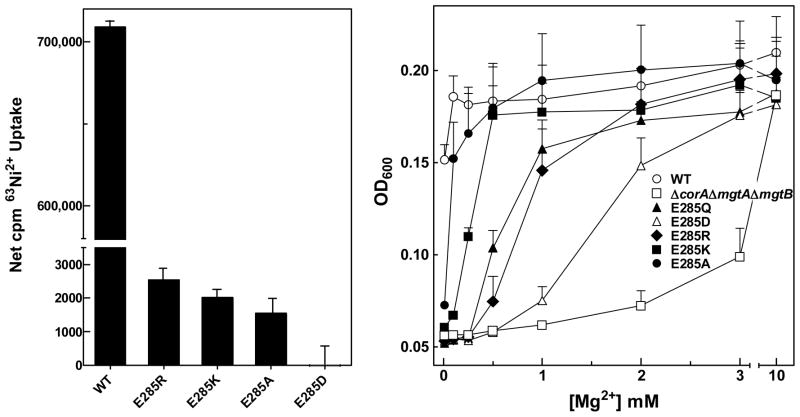
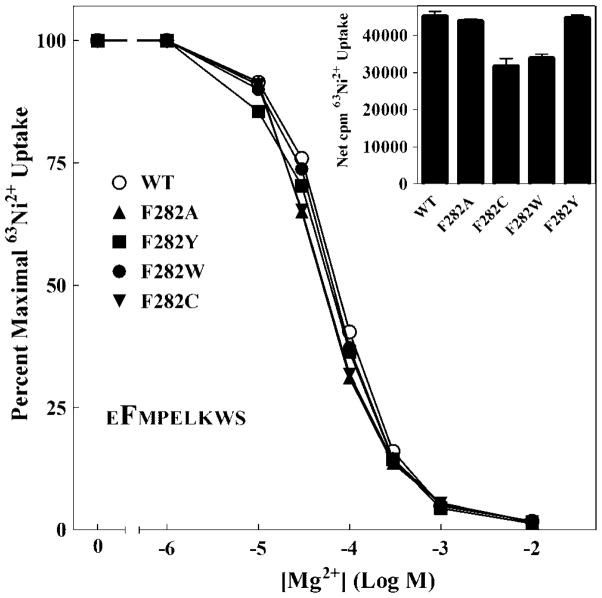
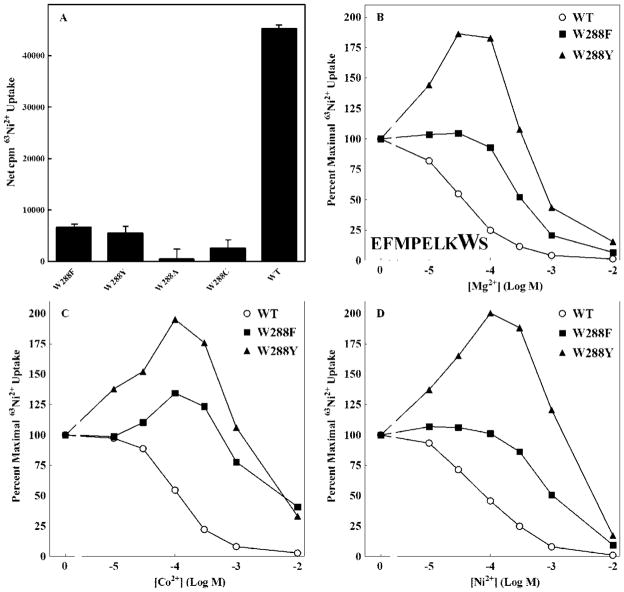
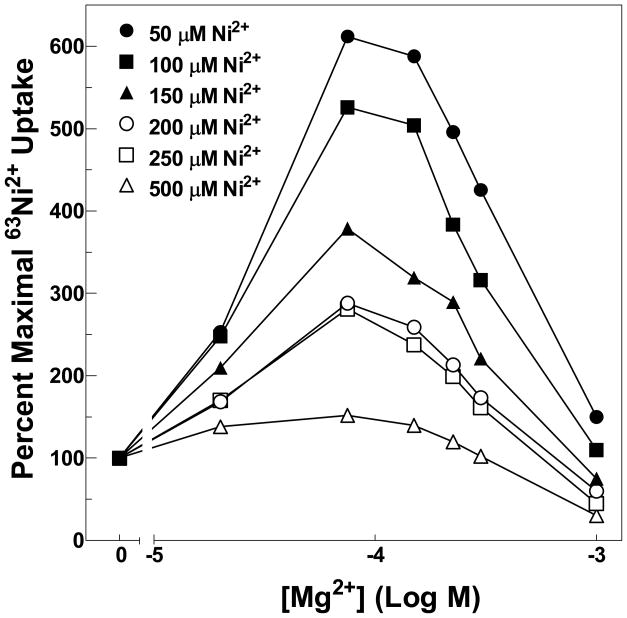
The CorA Mg(2+) channel is the primary uptake system in about half of all bacteria and archaea. However, the basis for its Mg(2+) selectivity is unknown. Previous data suggested that CorA binds a fully hydrated Mg(2+) ion, unlike other ion channels. The crystal structure of Thermotoga maritima CorA shows a homopentamer with two transmembrane segments per monomer connected by a short periplasmic loop. This highly conserved loop, (281)EFMPELKWS(289) in Salmonella enterica serovar Typhimurium CorA, is the only portion of the channel outside of the cell, suggesting a role in cation selectivity. Mutation of charged residues in the loop, E281 and K287, to any of several amino acids had little effect, demonstrating that despite conservation electrostatic interactions with these residues are not essential. While mutation of the universally conserved E285 gave a minimally functional channel, E285A and E285K mutants were the most functional, again indicating that the negative charge at this position is not a determining factor. Several mutations at K287 and W288 behaved anomalously in a transport assay. Analysis indicated that mutation of K287 and W288 disrupts cooperative interactions between distinct Mg(2+) binding sites. Overall, these results are not compatible with electrostatic interaction of the Mg(2+) ion with the periplasmic loop. Instead, the loop appears to form an initial binding site for hydrated Mg(2+), not for the dehydrated cation. The loop residues may function to accelerate dehydration of the before entry of Mg(2+) into the pore of the channel.
Figures
Similar articles
-
Loss of cytosolic Mg2+ binding sites in the Thermotoga maritima CorA Mg2+ channel is not sufficient for channel opening.Biochim Biophys Acta Gen Subj. 2019 Jan;1863(1):25-30. doi: 10.1016/j.bbagen.2018.09.001. Epub 2018 Sep 5. Biochim Biophys Acta Gen Subj. 2019. PMID: 30293964 Free PMC article.
-
Exploring the structure and function of Thermotoga maritima CorA reveals the mechanism of gating and ion selectivity in Co2+/Mg2+ transport.Biochem J. 2013 May 1;451(3):365-74. doi: 10.1042/BJ20121745. Biochem J. 2013. PMID: 23425532 Free PMC article.
-
The CorA Mg2+ transport protein of Salmonella typhimurium. Mutagenesis of conserved residues in the third membrane domain identifies a Mg2+ pore.J Biol Chem. 1998 Oct 30;273(44):28663-9. doi: 10.1074/jbc.273.44.28663. J Biol Chem. 1998. PMID: 9786860
-
Magnesium transporters: properties, regulation and structure.Front Biosci. 2006 Sep 1;11:3149-63. doi: 10.2741/2039. Front Biosci. 2006. PMID: 16720382 Review.
-
The CorA family: structure and function revisited.Cell Mol Life Sci. 2007 Oct;64(19-20):2564-74. doi: 10.1007/s00018-007-7174-z. Cell Mol Life Sci. 2007. PMID: 17619822 Free PMC article. Review.
Cited by
-
Initial binding of ions to the interhelical loops of divalent ion transporter CorA: replica exchange molecular dynamics simulation study.PLoS One. 2012;7(8):e43872. doi: 10.1371/journal.pone.0043872. Epub 2012 Aug 30. PLoS One. 2012. PMID: 22952795 Free PMC article.
-
Structural asymmetry in the magnesium channel CorA points to sequential allosteric regulation.Proc Natl Acad Sci U S A. 2012 Nov 13;109(46):18809-14. doi: 10.1073/pnas.1209018109. Epub 2012 Oct 29. Proc Natl Acad Sci U S A. 2012. PMID: 23112165 Free PMC article.
-
The periplasmic loop provides stability to the open state of the CorA magnesium channel.J Biol Chem. 2012 Aug 10;287(33):27547-55. doi: 10.1074/jbc.M112.371484. Epub 2012 Jun 21. J Biol Chem. 2012. PMID: 22722933 Free PMC article.
-
A repulsion mechanism explains magnesium permeation and selectivity in CorA.Proc Natl Acad Sci U S A. 2014 Feb 25;111(8):3002-7. doi: 10.1073/pnas.1319054111. Epub 2014 Feb 10. Proc Natl Acad Sci U S A. 2014. PMID: 24516146 Free PMC article.
-
Loss of cytosolic Mg2+ binding sites in the Thermotoga maritima CorA Mg2+ channel is not sufficient for channel opening.Biochim Biophys Acta Gen Subj. 2019 Jan;1863(1):25-30. doi: 10.1016/j.bbagen.2018.09.001. Epub 2018 Sep 5. Biochim Biophys Acta Gen Subj. 2019. PMID: 30293964 Free PMC article.
References
-
- Cowan JA. Metallobiochemistry of Magnesium. Coordination Complexes with Biological Substrates: Site Specificity, Kinetics and Thermodynamics of Binding, and Implications for Activity. Inorganic Chemistry. 1991;30:2740–2747.
-
- Cowan JA. Metal activation of enzymes in nucleic acid biochemistry. Chem Rev. 1998;98:1067–1087. - PubMed
-
- Cowan JA, Ohyama T, Howard K, Rausch JW, Cowan SM, Le Grice SF. Metal-ion stoichiometry of the HIV-1 RT ribonuclease H domain: evidence for two mutually exclusive sites leads to new mechanistic insights on metal-mediated hydrolysis in nucleic acid biochemistry. J Biol Inorg Chem. 2000;5:67–74. - PubMed
-
- Dann CE, III, Wakeman CA, Sieling CL, Baker SC, Irnov I, Winkler WC. Structure and mechanism of a metal-sensing regulatory RNA. Cell. 2007;130:878–892. - PubMed
Publication types
MeSH terms
Substances
Grants and funding
LinkOut - more resources
Full Text Sources
