. 2010 Jun 22:9:30.
doi: 10.1186/1475-925X-9-30.

Head and neck lymph node region delineation with image registration

Affiliations

Head and neck lymph node region delineation with image registration

Chia-Chi Teng et al. Biomed Eng Online. .

Abstract

Background: The success of radiation therapy depends critically on accurately delineating the target volume, which is the region of known or suspected disease in a patient. Methods that can compute a contour set defining a target volume on a set of patient images will contribute greatly to the success of radiation therapy and dramatically reduce the workload of radiation oncologists, who currently draw the target by hand on the images using simple computer drawing tools. The most challenging part of this process is to estimate where there is microscopic spread of disease.

Methods: Given a set of reference CT images with "gold standard" lymph node regions drawn by the experts, we are proposing an image registration based method that could automatically contour the cervical lymph code levels for patients receiving radiation therapy. We are also proposing a method that could help us identify the reference models which could potentially produce the best results.

Results: The computer generated lymph node regions are evaluated quantitatively and qualitatively.

Conclusions: Although not conforming to clinical criteria, the results suggest the technique has promise.


Figures

Figure 1
Figure 1
Illustration of target volumes. (Courtesy of Mary Austin-Seymour [25]).
Figure 2
Figure 2
System components block diagram.
Figure 3
Figure 3
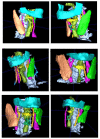
Examples of automatic segmentation results for selected subjects: (a) cervical spine, (b) respiratory tract, (c) mandible, (d) hyoid, (e) thyroid cartilage, (f) jugular vein, (g) common carotid artery, and (h) sternocleidomastoid muscle.
Figure 4
Figure 4
Measuring distance d(pR, ST) in between sample point pR on reference mesh surface on the left and target mesh ST on the right. The bar graph on the left indicates distance measurement in centimeter corresponding to the shade of SR.
Figure 5
Figure 5
Comparison of results from the image registration methods with and without using landmark correspondence. Rows A-E show selected axial CT slices in the neighborhood of the hyoid in various data sets from superior to inferior. Column 1 shows slices from the reference subject, column 4 from the target subject, column 2 is the result of Mattes' image registration method, and column 3 is the result of the new method using landmark correspondence.
Figure 6
Figure 6
Hausdorff and mean distance (in cm) between transformed reference mesh and the target mesh of nodal regions for all SR and ST, comparing image registration results from Mattes method and the proposed landmark method.
Figure 7
Figure 7
Sample result of lymph node region projection: (a) level IA, (b)(c) level IB, (d)(e) level II, (f)(g) level III, and (h)(i) level V. Each color region corresponds to a lymph node region.
Figure 8
Figure 8
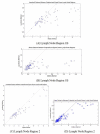
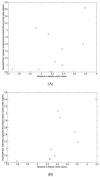
Examples of correlation between the proposed distance measure DF in feature vector space (horizontal axis) and the Hausdorff distance DH between the projected lymph node regions resulting from registration and those hand-drawn by experts (vertical axis). Figures A and B compare correlation for two different lymph node regions. Each point in the figures correspond a test subject.
Figure 9
Figure 9
Comparison between projected lymph node regions and expert drawn regions. Column 1 on the left shows projected regions from Mattes' method; column 3 on the right shows results from the new method using landmark information. Regions in column 2 are drawn by a radiation oncologist and considered to be clinically acceptable.

Similar articles

Cited by

References

    1. Greenlee RT, Murray T, Bolden S, Wingo PA. Cancer Statistics. CA-A Cancer J Clin. 2000;50:7–33. doi: 10.3322/canjclin.50.1.7. - DOI - PubMed
    1. International Commission on Radiation Units and Measurements. Prescribing, Recording and Reporting Photon Beam Therapy. Bethesda, MD, International Commission on Radiation Units and Measurements, Report 50; 1993.
    1. International Commission on Radiation Units and Measurements. Prescribing, Recording and Reporting Photon Beam Therapy (Supplement to ICRU Report 50) Bethesda, MD, International Commission on Radiation Units and Measurements, Report 62; 1999.
    1. Chao KSC, Wippold FJ, Ozyigit F, Tran BN, Dempsey JF. Determination and Delineation of Nodal Target volumes for Head-and-Neck Cancer Based on Patterns of Failure in Patients Receiving Definitive and Postoperative IMRT. Int Journal of Radiation Oncology Biol Phys. 2002;53:1174–1184. doi: 10.1016/S0360-3016(02)02881-X. - DOI - PubMed
    1. Teng C, Shapiro LG, Kalet IJ. Automatic segmentation of neck CT images. Proc. 19th IEEE International Symposium on Computer-Based Medical Systems. 2006. pp. 442–445. full_text.

MeSH terms