

Clinical correlations of grey matter reductions in the caudate nucleus of adults with attention deficit hyperactivity disorder
- PMID: 20569650
- PMCID: PMC2895154
- DOI: 10.1503/jpn.090099
Clinical correlations of grey matter reductions in the caudate nucleus of adults with attention deficit hyperactivity disorder
Abstract
Background: Magnetic resonance imaging (MRI) studies have shown decreased caudate volumes in individuals with attention deficit hyperactivity disorder (ADHD). However, most of these studies have been carried out in male children. Very little research has been done in adults, and the results obtained in children are difficult to extrapolate to adults. We sought to compare the volume of the caudate of adults with ADHD with that of healthy controls; we also compared these volumes between men and women.
Methods: We performed an MRI scan on 20 adults with ADHD (10 men and 10 women) aged 25-35 years and 20 healthy controls matched by age and sex. We used voxel-based morphometry with the DARTEL algorithm for image analyses. We used the specifically designed Friederichsen, Almeida, Serrano, Cortes Test (FASCT) to measure the severity of ADHD; both the self-reported (FASCT-SR) and the observer (FASCT-O) versions were used.
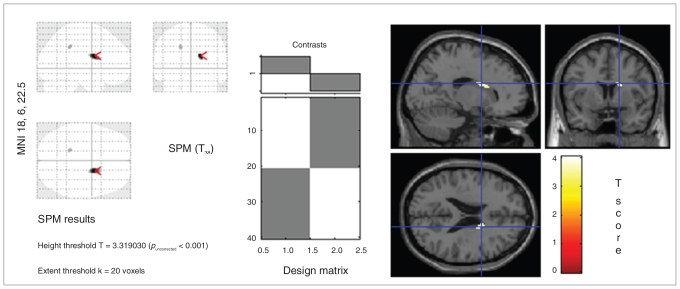
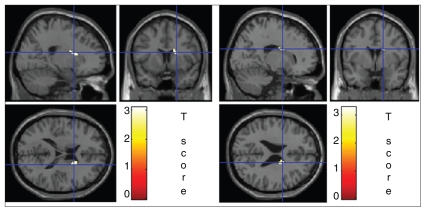
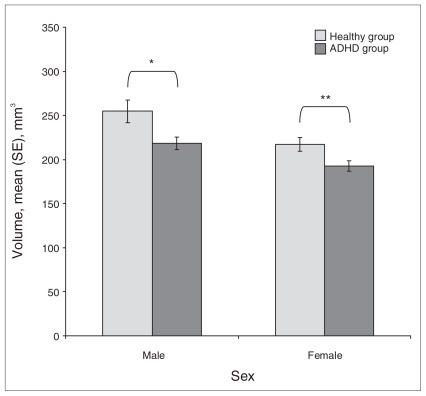
Results: The statistical parametric map showed a smaller region with low grey matter volume and a smaller concentration of grey matter in this region of the right caudate in ADHD patients than in health controls, both in the entire sample and within each sex. There was a significant correlation between the volume of this region of the caudate with the number of DSM IV-TR criteria, as well as with the total scores and most of the factors of the FASCT-SR and FASCT-O scales. A separate correlation analysis by sex gave similar results.
Limitations: The study design was cross-sectional.
Conclusion: The region of the right caudate with low grey matter volume was smaller in adults with ADHD in both sexes and was correlated with ADHD severity.
Figures
References
-
- Biederman J, Faraone S, Spencer T, et al. Patterns of psychiatric comorbility, cognition, and psychosocial functioning in adults with attention deficit hyperactivity disorder. Am J Psychiatry. 1993;150:1792–8. - PubMed
-
- Biederman J. Attention-deficit/hyperactivity disorder: a selective overview. Biol Psychiatry. 2005;57:1215–20. - PubMed
-
- Hynd GW, Semrud-Clikeman M, Lorys A, et al. Brain morphology in developmental dyslexia and attention deficit/hyperactivity. Arch Neurol. 1990;47:919–26. - PubMed
-
- Valera EM, Faraone SV, Murray KE, et al. Meta-analysis of structural imaging findings in attention-deficit/hyperactivity disorder. Biol Psychiatry. 2007;61:1361–9. - PubMed
Publication types
MeSH terms
LinkOut - more resources
Full Text Sources
Medical
Research Materials