

Obesity is linked with lower brain volume in 700 AD and MCI patients
- PMID: 20570405
- PMCID: PMC3197833
- DOI: 10.1016/j.neurobiolaging.2010.04.006
Obesity is linked with lower brain volume in 700 AD and MCI patients
Abstract
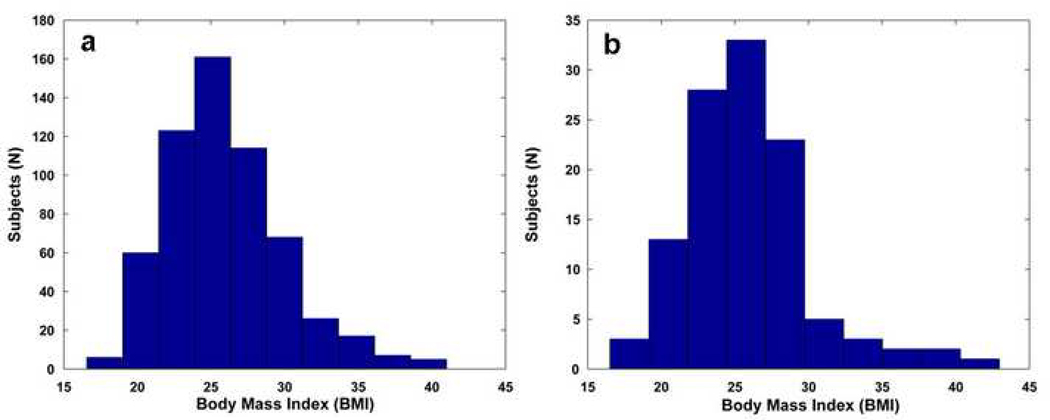
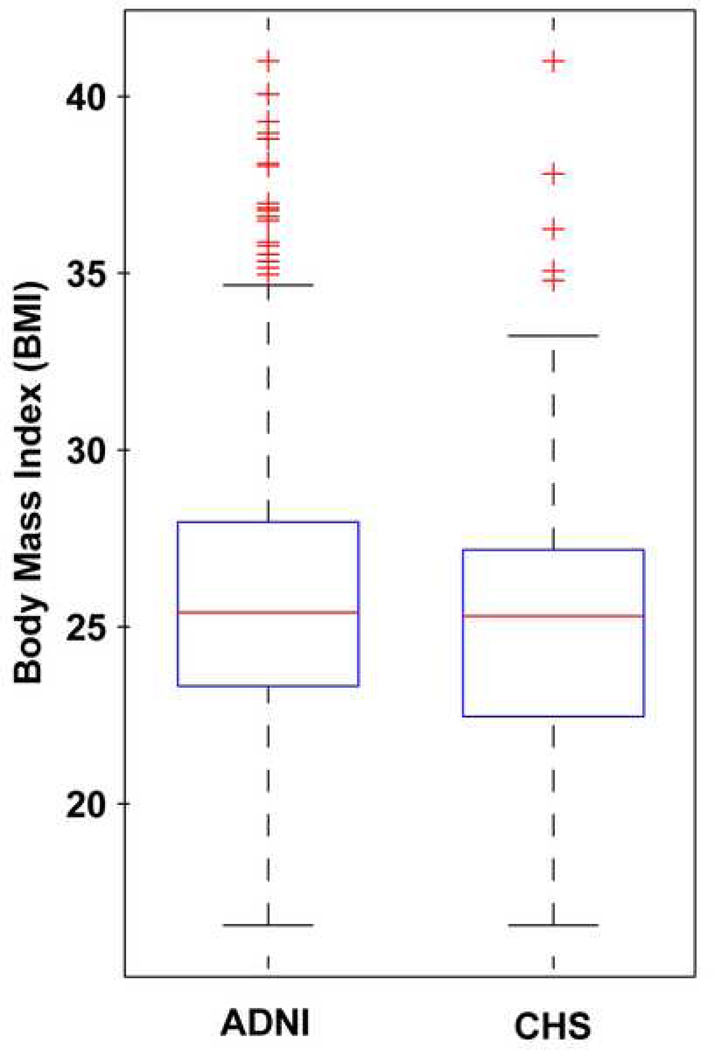
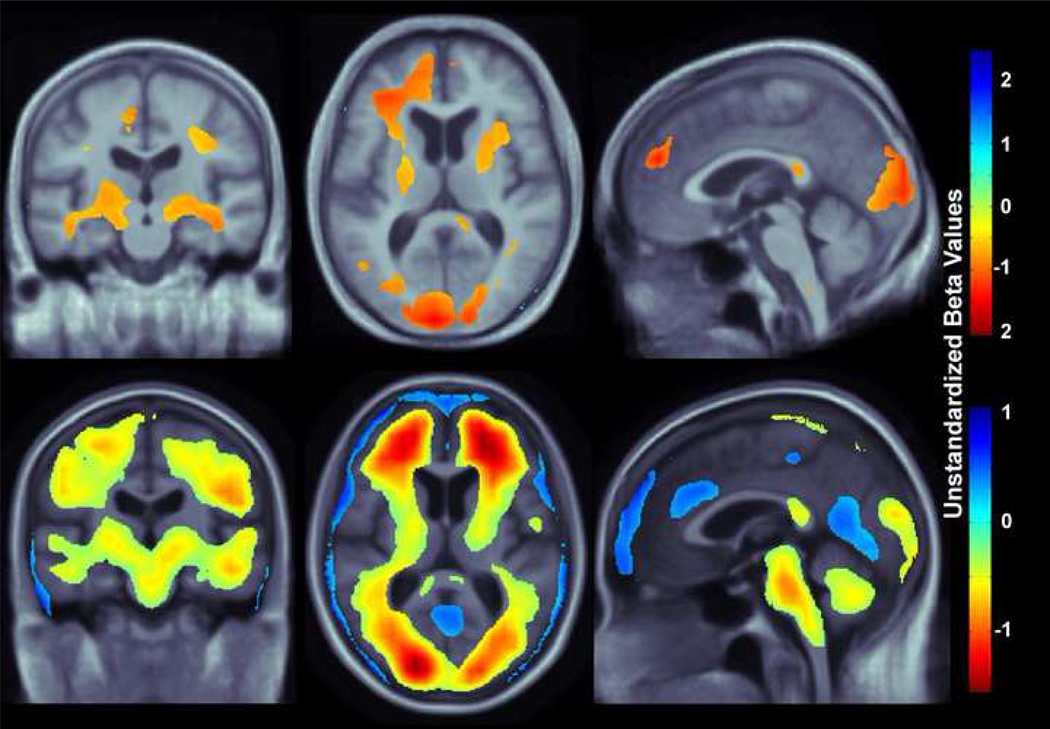
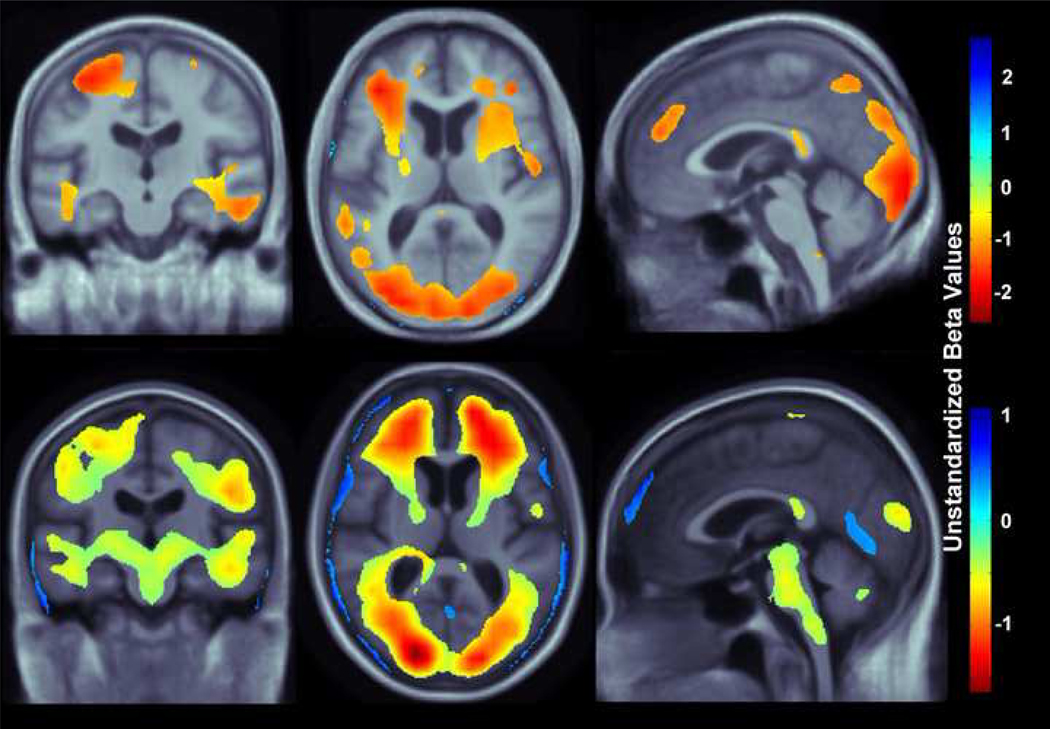
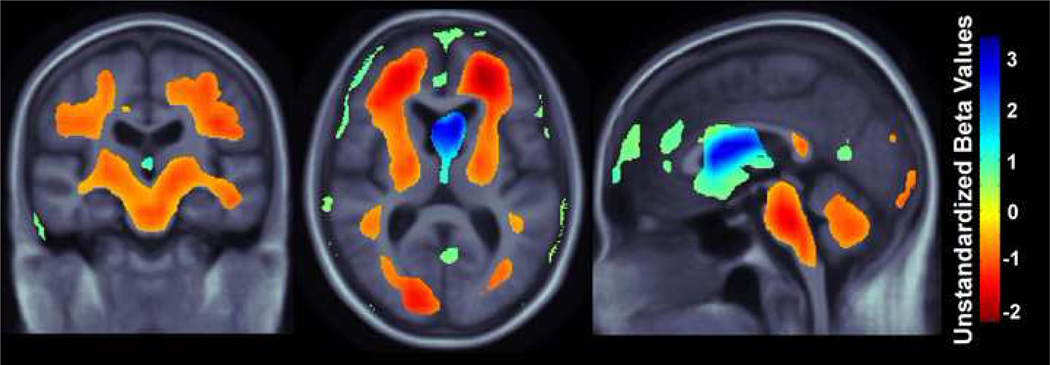
Obesity is associated with lower brain volumes in cognitively normal elderly subjects, but no study has yet investigated the effects of obesity on brain structure in patients with mild cognitive impairment (MCI) or Alzheimer's disease (AD). To determine if higher body mass index (BMI) is associated with brain volume deficits in cognitively impaired elderly subjects, we analyzed brain magnetic resonance imaging (MRI) scans of 700 MCI or AD patients from 2 different cohorts: the Alzheimer's Disease Neuroimaging Initiative (ADNI) and the Cardiovascular Health Study-Cognition Study (CHS-CS). Tensor-based morphometry (TBM) was used to create 3-dimensional maps of regional tissue excess or deficits in subjects with MCI (ADNI, n = 399; CHS-CS, n = 77) and AD (ADNI, n = 188; CHS, n = 36). In both AD and MCI groups, higher body mass index was associated with brain volume deficits in frontal, temporal, parietal, and occipital lobes; the atrophic pattern was consistent in both ADNI and CHS populations. Cardiovascular risk factors, especially obesity, should be considered as influencing brain structure in those already afflicted by cognitive impairment and dementia.
2010 Elsevier Inc. All rights reserved.
Conflict of interest statement
Figures
References
-
- Arden R, Gottfredson L, Miller G. Does a fitness factor conribute to the association between inteligence and health outcomes? Evidence from medical abnormality counts among 3,654 US Veterans. Intelligence. 2009;37:581–591.
-
- Ashburner J, Friston KJ. Voxel-based morphometry--the methods. Neuroimage. 2000;11(6 Pt 1):805–821. - PubMed
-
- Barlett HL, Puhl SM, Hodgson JL, Buskirk ER. Fat-free mass in relation to stature: ratios of fat-free mass to height in children, adults, and elderly subjects. Am J Clin Nutr. 1991;53(5):1112–1116. - PubMed
-
- Benjamini Y, Hochberg Y. Controlling the false discovery rate: a practical and powerful approach to multiple testing. JR Statist Soc B. 1995;57(1):289–300.
-
- Berg L. Clinical Dementia Rating (CDR) Psychopharmacol Bull. 1988;24(4):637–639. - PubMed
Publication types
MeSH terms
Grants and funding
- K01 AG030514/AG/NIA NIH HHS/United States
- N01-HC-85085/HC/NHLBI NIH HHS/United States
- N01-HC-85081/HC/NHLBI NIH HHS/United States
- R56 AG020098/AG/NIA NIH HHS/United States
- N01 HC085085/HC/NHLBI NIH HHS/United States
- N01-HC-85086/HC/NHLBI NIH HHS/United States
- N01-HC-85082/HC/NHLBI NIH HHS/United States
- N01 HC055222/HL/NHLBI NIH HHS/United States
- U54 RR021813/RR/NCRR NIH HHS/United States
- N01 HC045133/HC/NHLBI NIH HHS/United States
- N01 HC035129/HC/NHLBI NIH HHS/United States
- N01 HC085086/HC/NHLBI NIH HHS/United States
- N01 HC085080/HL/NHLBI NIH HHS/United States
- R01 EB007813/EB/NIBIB NIH HHS/United States
- AG15928/AG/NIA NIH HHS/United States
- N01 CN015103/CA/NCI NIH HHS/United States
- R01 AG015928/AG/NIA NIH HHS/United States
- U01 HL080295/HL/NHLBI NIH HHS/United States
- N01 HC085082/HL/NHLBI NIH HHS/United States
- N01 HC075150/HC/NHLBI NIH HHS/United States
- U01 AG024904/AG/NIA NIH HHS/United States
- N01 HC015103/HC/NHLBI NIH HHS/United States
- N01 HC085086/HL/NHLBI NIH HHS/United States
- U19 AG010483/AG/NIA NIH HHS/United States
- N01 HC085083/HL/NHLBI NIH HHS/United States
- U54-RR021813/RR/NCRR NIH HHS/United States
- N01 HC-55222/HC/NHLBI NIH HHS/United States
- R01 HD050735/HD/NICHD NIH HHS/United States
- AG05133/AG/NIA NIH HHS/United States
- R01 EB008432/EB/NIBIB NIH HHS/United States
- N01 HC085079/HL/NHLBI NIH HHS/United States
- N01-HC-85083/HC/NHLBI NIH HHS/United States
- N01-HC-75150/HC/NHLBI NIH HHS/United States
- N01-HC-85080/HC/NHLBI NIH HHS/United States
- P50 AG005133/AG/NIA NIH HHS/United States
- N01 HC085084/HC/NHLBI NIH HHS/United States
- R01 AG020098/AG/NIA NIH HHS/United States
- N01-HC-85079/HC/NHLBI NIH HHS/United States
- P30 AG010129/AG/NIA NIH HHS/United States
- R01 EB008281/EB/NIBIB NIH HHS/United States
- AG20098/AG/NIA NIH HHS/United States
- N01 HC085079/HC/NHLBI NIH HHS/United States
- N01 HC085081/HL/NHLBI NIH HHS/United States
- N01-HC-85084/HC/NHLBI NIH HHS/United States
LinkOut - more resources
Full Text Sources
Medical
