Review
. 2011 Feb;37(1):63-74.
doi: 10.1016/j.ctrv.2010.05.001. Epub 2010 Jun 8.

The unique characteristics of tumor vasculature and preclinical evidence for its selective disruption by Tumor-Vascular Disrupting Agents

Affiliations
Review

The unique characteristics of tumor vasculature and preclinical evidence for its selective disruption by Tumor-Vascular Disrupting Agents

Dietmar W Siemann. Cancer Treat Rev. 2011 Feb.

Abstract

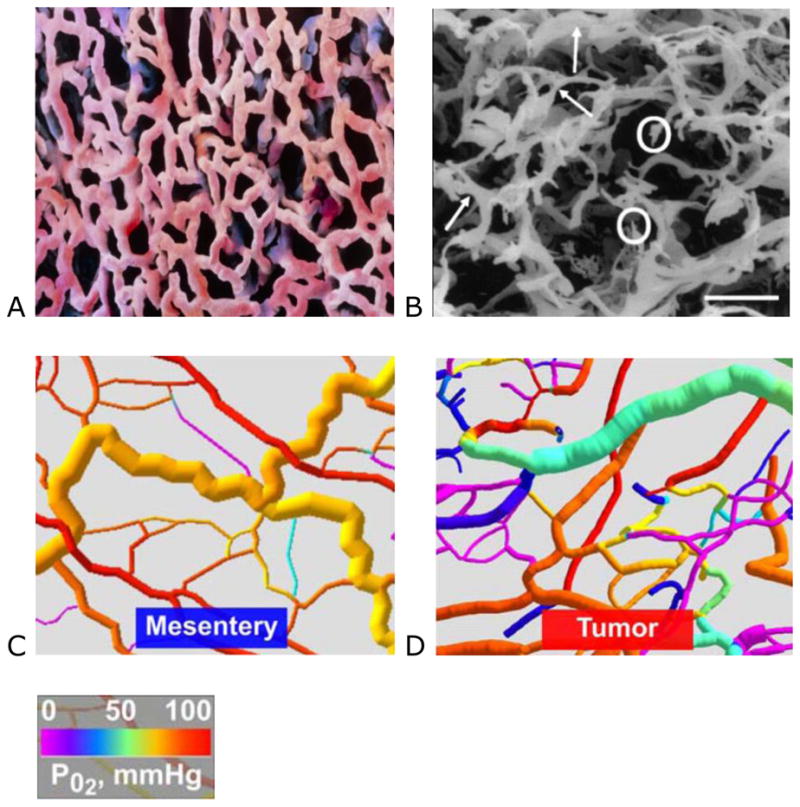
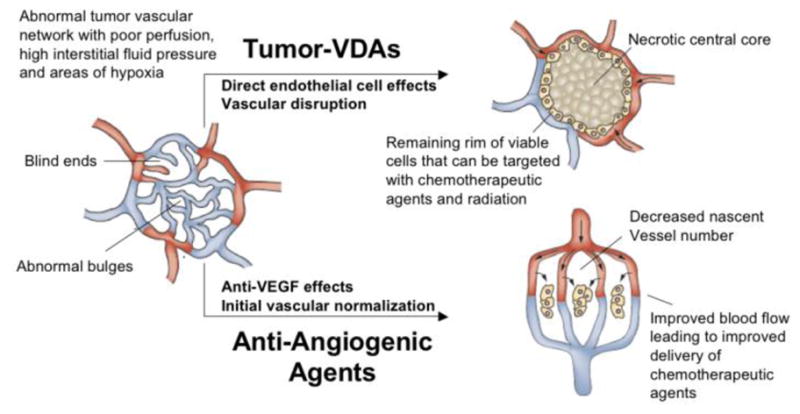
The vasculature of solid tumors is fundamentally different from that of normal vasculature and offers a unique target for anti-cancer therapy. Direct vascular-targeting with Tumor-Vascular Disrupting Agents (Tumor-VDAs) is distinctly different from anti-angiogenic strategies, and offers a complementary approach to standard therapies. Tumor-VDAs therefore have significant potential when combined with chemotherapy, radiotherapy, and angiogenesis-inhibiting agents. Preclinical studies with the different Tumor-VDA classes have demonstrated key tumor-selective anti-vascular and anti-tumor effects.


Conflict of interest statement

Conflict of Interest Statement

The author is a member of the Scientific Advisory Board of OXiGENE, Inc.

Figures

Figure 1
Figure 1
Panel A: scanning electron microscopy (SEM) image of a microvascular cast from normal lung tissue (Prof. P. Motta, G. Macchiarelli University, La Sapienza, Rome. Science Photo Library) and Panel B: An SEM of a human sigmoidal adenocarcinoma (bar = 100 μm), showing blind ends (circled) and abnormal bulges (arrowed) (used with permission from Macmillan Publishers Ltd: Br J Cancer 2001; 84:1354–1362. Copyright 2001). Panels C and D: Computer visualization of mesenteric and tumor vascular networks, color coded for pO2 showing poorer oxygenation in areas of restricted flow and blind endings (used with permission).
Figure 2
Figure 2
Diagram illustrating the different preclinical effects of angiogenesis-inhibiting agents (AIAs) and Tumor-Vascular Disrupting Agents (Tumor-VDAs) on abnormal tumor blood vessels. Treatment with AIAs leads to vessel normalization, allowing efficient delivery of chemotherapeutic agents and increased oxygenation to aid radiotherapy. In contrast, Tumor-VDA treatment leads to vascular disruption and extensive central necrosis, leaving a thin rim of surviving viable cells that can be targeted with standard therapies (adapted and redrawn with permission from Macmillan Publishers Ltd: Nat Rev Clin Oncol 2009; 6:395–404. Copyright 2009).,
Figure 3
Figure 3
Effect of CA4P treatment on endothelial cell shape. Proliferating endothelial cells were untreated or treated with either 1 or 10 μM CA4P for a period of 2 h prior to staining microtubules (red, rotamine) and actin (green, fluorescein phalloidin). Arrows indicate the condensation of microtubules and rounding of endothelial cells (used with permission).
Figure 4
Figure 4
Hematoxylin and eosin stained section (at x 200 magnification) of KHT sarcoma treated with OXi4503 (25 mg/kg). The post-treatment necrotic tumor is defined by the double-headed arrow while the two- or three-cell layer of the viable tumor rim is shown with a single-headed arrow. Preserved muscle (*) and blood vessels (black arrowheads) are clearly evident in the surrounding, unaffected tissue (Siemann DW, unpublished results).
Figure 5
Figure 5
Selective induction of tumor vascular endothelial cell apoptosis (arrows) in the Colon 38 tumor (A,D) compared with mouse heart (B,E) and mouse liver (C,F). Untreated (upper panels) and ASA404-treated (25 mg/kg, 3h) (lower panels). C57B1/6 mice were stained for TdT-mediated dUTP nick-end labeling (TUNEL) with alkaline phosphatase (used with permission from Macmillan Publishers Ltd: Br J Cancer 2004; 90:906–910. Copyright 2004).
Figure 6
Figure 6
Contrast enhanced magnetic resonance imaging (MRI) images in an orthotopic head and neck cancer mouse model showing lack of enhancement in the ASA404-treated tumor indicating reduced vascular perfusion (top and bottom panels), and dark, hypo-intense regions in the tumor but not in the surrounding area (middle panels), suggesting selective tumor vascular hemorrhage (used with permission).
Figure 7
Figure 7
Comparison of the decrease in relative perfusion and necrotic fraction of KHT tumors in individual mice treated with CA4P. Dynamic contrast-enhanced magnetic resonance imaging measurements and histological analysis of tumor necrotic fraction were made on the same animal (data points represent individual animals); r=0.89, p<0.00001 (used with permission).
Figure 8
Figure 8
Comparison of the necrotic effects of a flavonoid Tumor-VDA (ASA404) and a tubulin-binding Tumor-VDA (ZD6126). Panel A: hematoxylin and eosin stained section of a G3H prolactinoma 24 hours post-treatment with ASA404 (350 mg/kg) Grade 4, extensive necrosis (n=necrotic tissue, v=viable tissue) and Panel B: control – Grade 1, no necrosis. Panel C: stained section of a Calu-6 lung cancer xenograft (x 16 magnification) post-treatment with ZD6126 (200 mg/kg) and Panel D: corresponding vehicle-treated control (N=necrotic tissue, V=viable tissue). Panels E (x 100) and F (x 400): magnifications showing a thin viable rim of cells remaining, and contrasting the necrotic and viable cells (used with permission).
Figure 9
Figure 9
Blood pressure measurements in mice made using thoracic aortic implantation of pressure-sensing catheters combined with the subcutaneous placement of transmitter bodies and monitoring by placing their cages on top of the telemetry receiver pads for data collection. Data are mean (± SD) arterial blood pressure (MABP) measurements in groups of 8 control (□) or CA4P-treated (100 mg/kg) (■) C3H mice; shaded area indicates normal range of MABP (Siemann DW, unpublished results).
Figure 10
Figure 10
Typical OXi4503 treatment progression in a 4T1 tumor. The brightfield images (upper panels) and HbSat maps (lower panels) show structural alterations in the vasculature through the course of a single treatment. The oxygenation levels in the HbSat maps are color coded as indicated by the colorbar. Arrows highlight the disintegrating vasculature, while the star indicates the avascular regions created by the OXi4503 treatment (redrawn with kind permission from Springer Science+Business Media: Oncol Rep 2010; 23:685–692. Wankhede M, et al. Figure 1. Copyright 2010).
Figure 11
Figure 11
Enhancement of radiation damage by ASA404 (A) and OXi4503 (B) in the murine KHT sarcoma model, assessed by clonogenic cell survival assay: radiation alone (closed symbols) and radiation plus ASA404 or OXi4503 (open symbols) (Panel A redrawn with kind permission from Springer Science+Business Media: Radiat Res 2001; 156:503–509. Murata R, et al. Figure 3. Copyright 2001).,
Figure 12
Figure 12
Interaction of ASA404 with chemotherapy. The dose modification factor was defined as the ratio of the effect with ASA404 plus cytotoxic agent versus cytotoxic agent alone (adapted with kind permission from Springer Science+Business Media: Cancer Chemother Pharmacol 2003; 51:43–52. Siim BG, et al. Table 1. Copyright 2003).
Figure 13
Figure 13
Response of Caki-1 tumors to bevacizumab (2 mg/kg, twice a week for 2 weeks), CA4P (A) or OXi4503 (B) (100 mg/kg or 25 mg/kg respectively, three times a week for 2 weeks) or the combination of an angiogenesis-inhibiting agent and Tumor-Vascular Disrupting Agent (median tumor responses of groups of 8–10 mice). Controls (■), bevacizumab (□), CA4P (○), OXi4503 (△), bevacizumab + CA4P (●), bevacizumab + OXi4503 (▲) (redrawn with permission).

References

    1. Konerding MA, Fait E, Gaumann A. 3D microvascular architecture of pre-cancerous lesions and invasive carcinomas of the colon. Br J Cancer. 2001;84:1354–1362. - PMC - PubMed
    1. Dewhirst MW, Kimura H, Rehmus S, et al. Microvascular studies on the origins of perfusion-limited hypoxia. Br J Cancer. 1996;27:S247–S251. - PMC - PubMed
    1. McDonald D, Choyke P. Imaging of angiogenesis: from microscope to clinic. Nature Med. 2003;9:713–725. - PubMed
    1. Leu A, Berk D, Lymboussaki A, et al. Absence of functional lymphatics within a murine sarcoma: a molecular and functional evaluation. Cancer Res. 2000;60:4324–4327. - PubMed
    1. Padera T, Kadambi A, di Tomaso E, et al. Lymphatic metastasis in the absence of functional intratumor lymphatics. Science. 2002;296:1883–1886. - PubMed

Publication types

MeSH terms

Substances