. 2010 Oct 1;52(4):1289-301.
doi: 10.1016/j.neuroimage.2010.05.049. Epub 2010 May 24.

Atlas-guided tract reconstruction for automated and comprehensive examination of the white matter anatomy

Affiliations

Atlas-guided tract reconstruction for automated and comprehensive examination of the white matter anatomy

Yajing Zhang et al. Neuroimage. .

Abstract

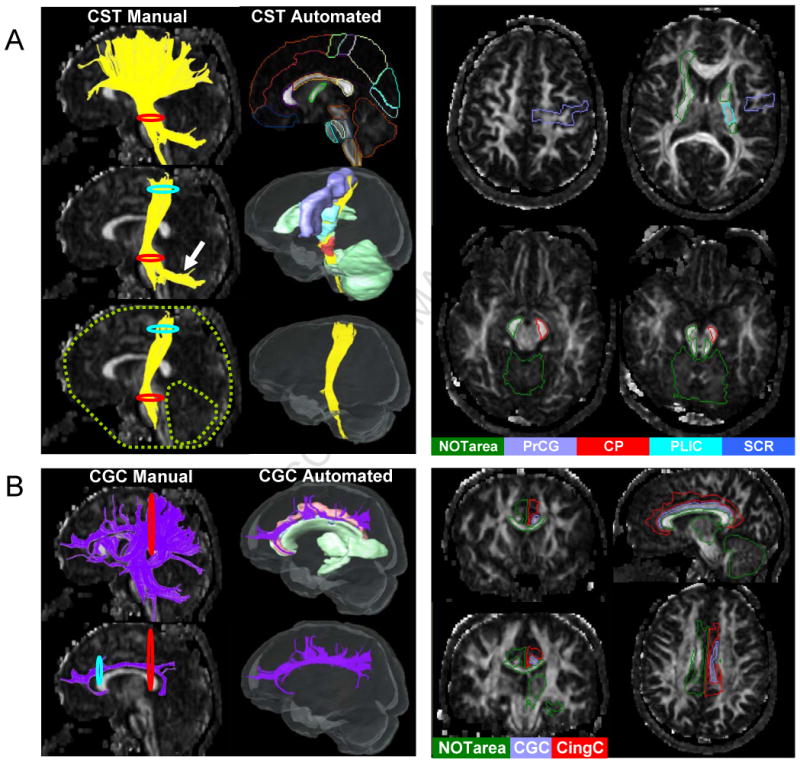
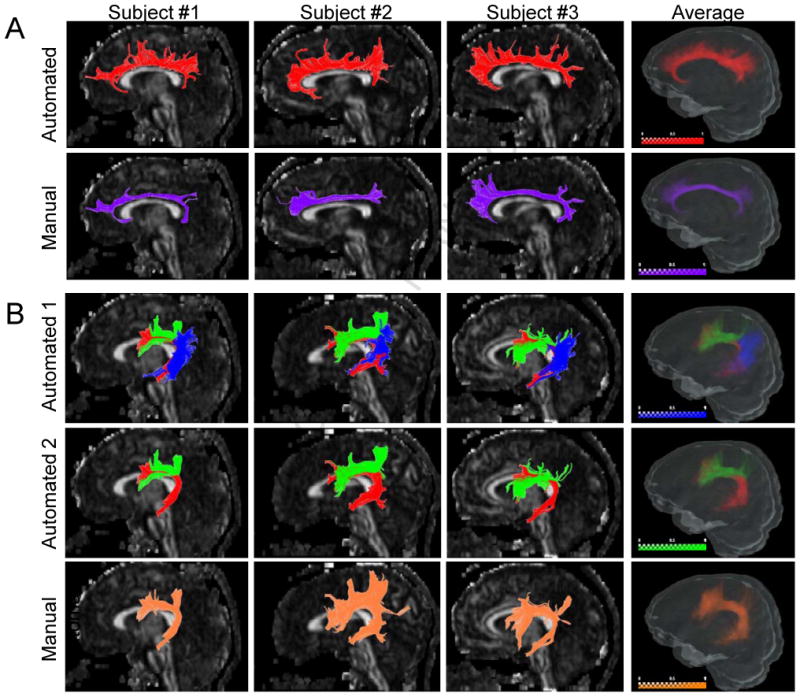
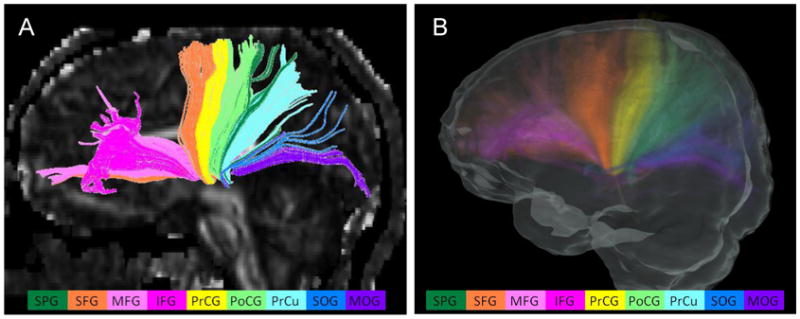
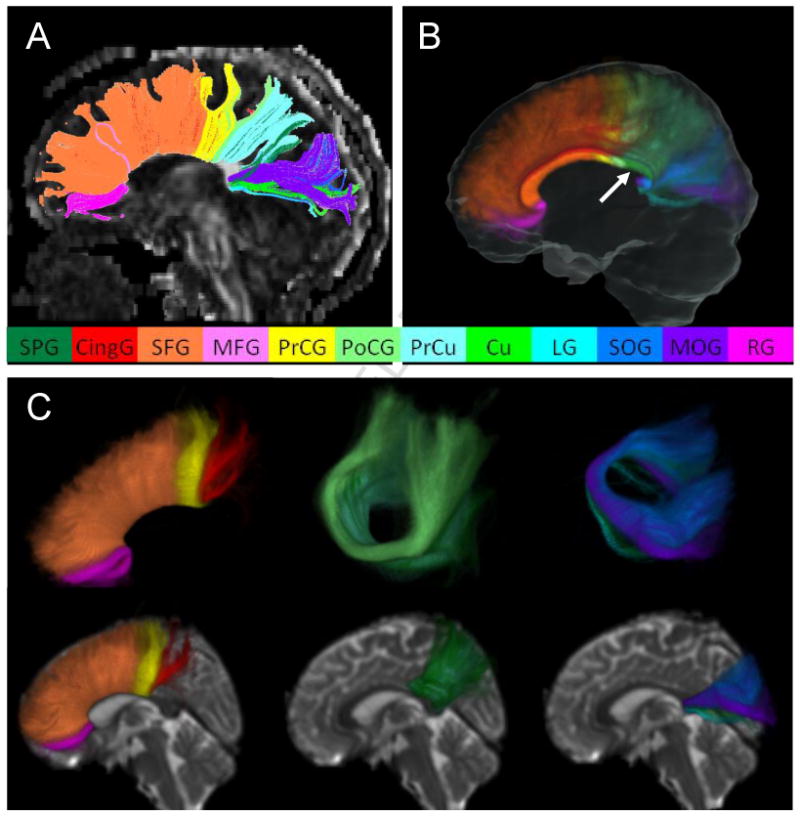
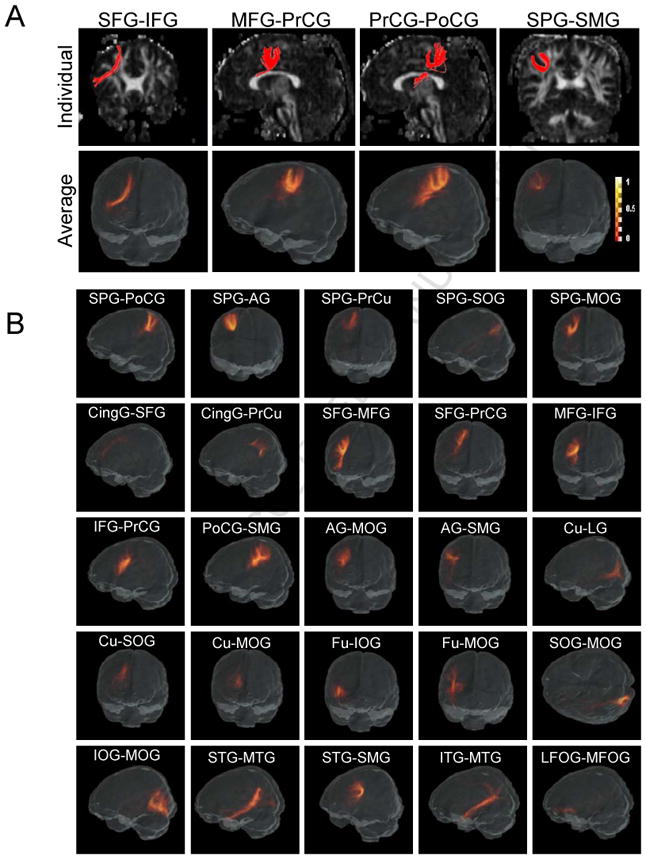
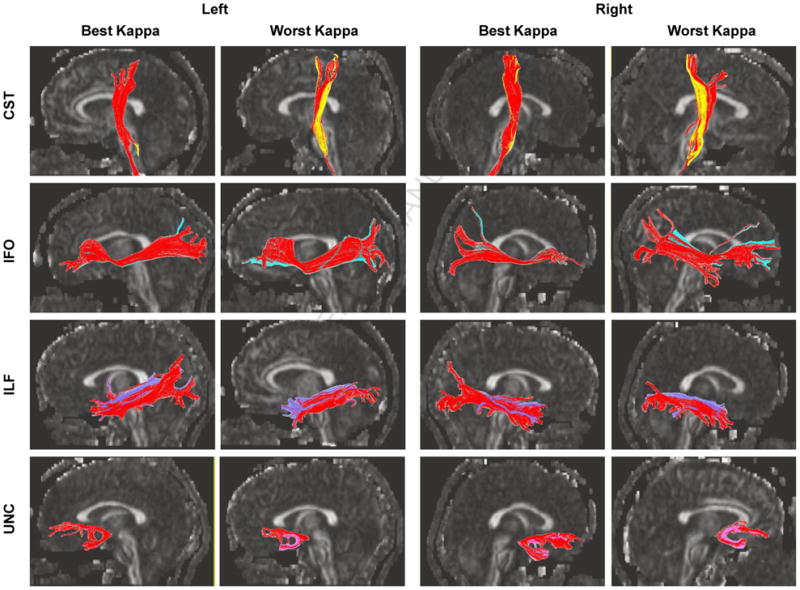
Tractography based on diffusion tensor imaging (DTI) is widely used to quantitatively analyze the status of the white matter anatomy in a tract-specific manner in many types of diseases. This approach, however, involves subjective judgment in the tract-editing process to extract only the tracts of interest. This process, usually performed by manual delineation of regions of interest, is also time-consuming, and certain tracts, especially the short cortico-cortical association fibers, are difficult to reconstruct. In this paper, we propose an automated approach for reconstruction of a large number of white matter tracts. In this approach, existing anatomical knowledge about tract trajectories (called the Template ROI Set or TRS) were stored in our DTI-based brain atlas with 130 three-dimensional anatomical segmentations, which were warped non-linearly to individual DTI data. We examined the degree of matching with manual results for selected fibers. We established 30 TRSs to reconstruct 30 prominent and previously well-described fibers. In addition, TRSs were developed to delineate 29 short association fibers that were found in all normal subjects examined in this paper (N=20). Probabilistic maps of the 59 tract trajectories were created from the normal subjects and were incorporated into our image analysis tool for automated tract-specific quantification.


Conflict of interest statement

The terms of this arrangement are being managed by the Johns Hopkins University in accordance with its conflict of interest policies.

Figures

Figure 1
Figure 1
Comparison of manual and automated fiber-tracking strategies in the cortico-spinal tract (Fig. 1A), and in the cingulum of cingulate gyrus (Fig. 1B). Fig. 1A: For manual tracking, the 2D red and blue circles represent the ROI operations “AND”, while the green dashed-line circles represent the ROI operation “NOT”. The cortico-ponto-cerebellar connection is shown as contamination by the white arrow. In automated tracking, the 3D red and blue solids represent “AND”, while the green solids represent “NOT” regions. Each brain was automatically segmented by the TRS pre-defined in the type II Eve Atlas (Fig. 1A- top right and 2D slices). Fig. 1B: For the manual tracking of the cingulum of cingulate gyrus (CGC), the pathway between the two 2D ROIs were placed at the anterior and posterior ends of the CGC, which reconstructed the core part of the CG with no branching in between (Fig. 1B-bottom left and 2D slices). With the atlas-based reconstruction, two 3D ROIs define the core CGC section and the cingulate gyrus, leading to a fundamentally different view of the CGC (Fig. 1B-bottom right).
Figure 2
Figure 2
Comparison of manual and automated results from Type-B tracts. Fig. 2A: Three representative individual cases and the probabilistic maps of the cingulum of cingulate gyrus (CGC) are shown for automated results (upper row, red fibers) and manual tracking results (bottom row, purple fibers). Fig. 2B: Three representative individual cases and the probabilistic maps of the superior longitudinal fasciculus (SLF) were shown for three components (upper row), and two components based on automated results (middle row), compared to the manual results (bottom row). In the upper row, the long, anterior, and posterior segments of the SLF are shown by red, green, and blue colors, respectively. In the middle row, the anterior segment (blue) is removed to demonstrate the similarity to the manual results. The intensity scale bar represents the probability.
Figure 3
Figure 3
Thalamic radiations of an individual case (A) and the probabilistic map (B). The reconstructed thalamic radiations include the projection fiber bundles to the frontal, parietal, and occipital lobes. Different colors of components represent the connections to different cortical regions defined in the atlas. The projections from the thalamus to the following cortical areas were observed in all subjects and are shown in different colors: superior parietal gyrus (dark green), superior frontal gyrus (orange), middle frontal gyrus (pink), inferior frontal gyrus (rose pink), pre-central gyrus (yellow), post-central gyrus (light green), pre-cuneus (light blue), superior occipital gyrus (navy blue), and middle occipital gyrus (purple). The intensity scale of the probabilistic map is the same as in Fig. 2
Figure 4
Figure 4
Commissural fibers from an individual case (A) and the probabilistic map (B and C). The fiber bundles penetrating the corpus callosum at the mid-sagittal section and connecting the cortices in both hemispheres are reconstructed. The fibers connecting the following cortical areas were reproducibly detectable and are shown in different colors: superior parietal gyrus (dark green), cingulate gyrus (red), superior frontal gyrus (orange), middle frontal gyrus (pink), pre-central gyrus (yellow), post-central gyrus (light green), pre-cuneus (light blue), cuneus (green), lingual gyrus (cyan), superior occipital gyrus (navy blue), middle occipital gyrus (purple), and rectus (rose pink). The mid-sagittal cross-section of the probabilistic map is shown in Fig. 4B, from which the subdivision of the corpus callosum can be seen. The unlabeled area of the corpus callosum (indicated by white arrows) corresponds to the projection to the tapetum, which is believed to connect the temporal lobes, and could not be reconstructed by the proposed automated approach. Fig. 4C shows several 3D views of the probabilistic maps of the fibers connecting the frontal lobe (left column), the parietal lobe (middle column), and the occipital lobe (right column), respectively. The intensity scale of the probabilistic map is the same as in Fig. 2
Figure 5
Figure 5
The short association fibers reconstructed by the TRS automated method. Fig. 5A: The individual cases and the probabilistic maps of four U-fibers connecting the following cortical region pairs are shown: a) the superior frontal - inferior frontal gyrus (SFG-IFG) (frontal short association fibers); b) the medial frontal - precentral gyrus (MFG-PrCG) (fronto-central short association fibers); c) the precentral - postcentral gyrus (PrCG-PoCG) (central short association fibers); and d) the superior frontal - supramarginal gyrus (SFG-SMG) (parietal short association fibers), which is consistent with our previous report. Fig. 5B: The probabilistic maps of the other 25 short association fibers that are identified in this report connect the cortical region pairs as indicated in the figure. * The color scale bar is the same for Fig. 5A and Fig. 5B.
Figure
Figure
Comparison between the manual and automated (red) reconstruction results for four white matter tracts. The results for the best and worst matching among 20 subjects are demonstrated.

References

    1. Alexander DC, Pierpaoli C, Basser PJ, Gee JC. Spatial transformations of diffusion tensor magnetic resonance images. IEEE Trans Med Imaging. 2001;20:1131–1139. - PubMed
    1. Ashburner J, Friston KJ. Voxel-based morphometry--the methods. Neuroimage. 2000;11:805–821. - PubMed
    1. Basser PJ, Mattiello J, LeBihan D. Estimation of the effective self-diffusion tensor from the NMR spin echo. J Magn Reson B. 1994;103:247–254. - PubMed
    1. Basser PJ, Pajevic S, Pierpaoli C, Duda J, Aldroubi A. In vitro fiber tractography using DT-MRI data. Magn Reson Med. 2000;44:625–632. - PubMed
    1. Behrens TE, Johansen-Berg H, Woolrich MW, Smith SM, Wheeler-Kingshott CA, Boulby PA, Barker GJ, Sillery EL, Sheehan K, Ciccarelli O, Thompson AJ, Brady JM, Matthews PM. Non-invasive mapping of connections between human thalamus and cortex using diffusion imaging. Nat Neurosci. 2003;6:750–757. - PubMed

Publication types

LinkOut - more resources