

Flavin-containing monooxygenase-3: induction by 3-methylcholanthrene and complex regulation by xenobiotic chemicals in hepatoma cells and mouse liver
- PMID: 20570689
- PMCID: PMC2906660
- DOI: 10.1016/j.taap.2010.05.018
Flavin-containing monooxygenase-3: induction by 3-methylcholanthrene and complex regulation by xenobiotic chemicals in hepatoma cells and mouse liver
Abstract
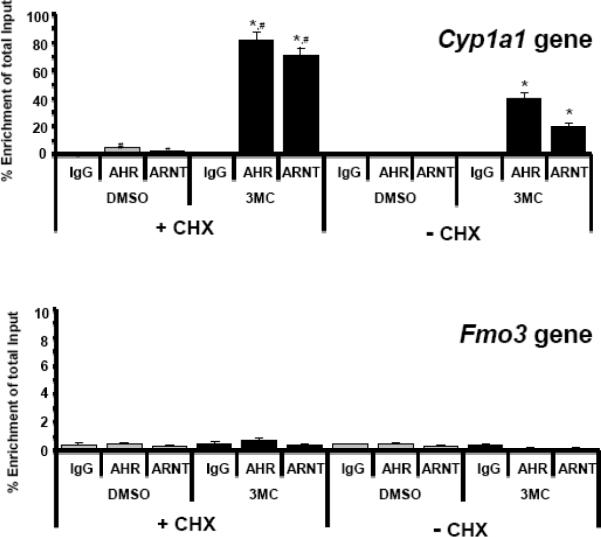
Flavin-containing monooxygenases often are thought not to be inducible but we recently demonstrated aryl hydrocarbon receptor (AHR)-dependent induction of FMO mRNAs in mouse liver by 2,3,7,8-tetrachlorodibenzo-p-dioxin (TCDD) (Celius et al., Drug Metab Dispos 36:2499, 2008). We now evaluated FMO induction by other AHR ligands and xenobiotic chemicals in vivo and in mouse Hepa1c1c7 hepatoma cells (Hepa-1). In mouse liver, 3-methylcholanthrene (3MC) induced FMO3 mRNA 8-fold. In Hepa-1 cells, 3MC and benzo[a]pyrene (BaP) induced FMO3 mRNA >30-fold. Induction by 3MC and BaP was AHR dependent but, surprisingly, the potent AHR agonist, TCDD, did not induce FMO3 mRNA in Hepa-1 cells nor did chromatin immunoprecipitation assays detect recruitment of AHR or ARNT to Fmo3 regulatory elements after exposure to 3MC in liver or in Hepa-1 cells. However, in Hepa-1, 3MC and BaP (but not TCDD) caused recruitment of p53 protein to a p53 response element in the 5'-flanking region of the Fmo3 gene. We tested the possibility that FMO3 induction in Hepa-1 cells might be mediated by Nrf2/anti-oxidant response pathways, but agents known to activate Nrf2 or to induce oxidative stress did not affect FMO3 mRNA levels. The protein synthesis inhibitor, cycloheximide (which causes "superinduction" of CYP1A1 mRNA in TCDD-treated cells), by itself caused dramatic upregulation (>300-fold) of FMO3 mRNA in Hepa-1 suggesting that cycloheximide prevents synthesis of a labile protein that suppresses FMO3 expression. Although FMO3 mRNA is highly induced by 3MC or TCDD in mouse liver and in Hepa-1 cells, FMO protein levels and FMO catalytic function showed only modest elevation.
(c) 2010 Elsevier Inc. All rights reserved.
Figures


Similar articles
-
Aryl hydrocarbon receptor-dependent induction of flavin-containing monooxygenase mRNAs in mouse liver.Drug Metab Dispos. 2008 Dec;36(12):2499-505. doi: 10.1124/dmd.108.023457. Epub 2008 Sep 2. Drug Metab Dispos. 2008. PMID: 18765683 Free PMC article.
-
2,3,7,8-Tetrachlorodibenzo-p-dioxin versus 3-methylcholanthrene: comparative studies of Ah receptor binding, transformation, and induction of CYP1A1.J Biol Chem. 1994 Apr 22;269(16):12118-28. J Biol Chem. 1994. PMID: 8163516
-
Regulation of the Cyp2a5 gene involves an aryl hydrocarbon receptor-dependent pathway.Mol Pharmacol. 2005 Apr;67(4):1325-33. doi: 10.1124/mol.104.008078. Epub 2005 Jan 18. Mol Pharmacol. 2005. PMID: 15657367
-
Isoform distinct time-, dose-, and castration-dependent alterations in flavin-containing monooxygenase expression in mouse liver after 2,3,7,8-tetrachlorodibenzo-p-dioxin treatment.Biochem Pharmacol. 2010 May 1;79(9):1345-51. doi: 10.1016/j.bcp.2009.12.020. Epub 2009 Dec 28. Biochem Pharmacol. 2010. PMID: 20036217 Free PMC article.
-
Aromatic hydrocarbon receptor (AhR).AhR nuclear translocator- and p53-mediated induction of the murine multidrug resistance mdr1 gene by 3-methylcholanthrene and benzo(a)pyrene in hepatoma cells.J Biol Chem. 2001 Feb 16;276(7):4819-27. doi: 10.1074/jbc.M008495200. Epub 2000 Nov 28. J Biol Chem. 2001. PMID: 11096091
Cited by
-
Flavin-containing monooxygenase (FMO): Beyond xenobiotics.Bioessays. 2024 Jul;46(7):e2400029. doi: 10.1002/bies.202400029. Epub 2024 May 7. Bioessays. 2024. PMID: 38713170 Free PMC article. Review.
-
Flavin-containing monooxygenases in aging and disease: Emerging roles for ancient enzymes.J Biol Chem. 2017 Jul 7;292(27):11138-11146. doi: 10.1074/jbc.R117.779678. Epub 2017 May 17. J Biol Chem. 2017. PMID: 28515321 Free PMC article. Review.
-
Effects of salinity acclimation on the expression and activity of Phase I enzymes (CYP450 and FMOs) in coho salmon (Oncorhynchus kisutch).Fish Physiol Biochem. 2014 Feb;40(1):267-78. doi: 10.1007/s10695-013-9842-2. Epub 2013 Aug 8. Fish Physiol Biochem. 2014. PMID: 23925894 Free PMC article.
-
Differential Fmo3 gene expression in various liver injury models involving hepatic oxidative stress in mice.Toxicology. 2014 Nov 5;325:85-95. doi: 10.1016/j.tox.2014.08.013. Epub 2014 Sep 2. Toxicology. 2014. PMID: 25193093 Free PMC article.
-
Relationship between serum trimethylamine N-oxide and exposure to dioxin-like pollutants.Environ Res. 2018 Apr;162:211-218. doi: 10.1016/j.envres.2018.01.007. Epub 2018 Jan 30. Environ Res. 2018. PMID: 29353125 Free PMC article.
References
-
- Anwar-Mohamed A, El-Kadi AO. Sulforaphane induces CYP1A1 mRNA, protein, and catalytic activity levels via an AhR-dependent pathway in murine hepatoma Hepa 1c1c7 and human HepG2 cells. Cancer Lett. 2009;275:93–101. - PubMed
-
- Cashman JR, Zhang J. Human flavin-containing monooxygenases. Annu Rev Pharmacol Toxicol. 2006;46:65–100. - PubMed
-
- Chung WG, Park CS, Roh HK, Cha YN. Induction of flavin-containing monooxygenase (FMO1) by a polycyclic aromatic hydrocarbon, 3-methylcholanthrene, in rat liver. Mol Cells. 1997;7:738–741. - PubMed
-
- Dale YR, Eltom SE. Calpain mediates the dioxin-induced activation and down-regulation of the aryl hydrocarbon receptor. Mol Pharmacol. 2006;70:1481–1487. - PubMed
Publication types
MeSH terms
Substances
Grants and funding
LinkOut - more resources
Full Text Sources
Research Materials
Miscellaneous
