

Three-dimensional structured illumination microscopy of liver sinusoidal endothelial cell fenestrations
- PMID: 20570732
- PMCID: PMC3043550
- DOI: 10.1016/j.jsb.2010.06.001
Three-dimensional structured illumination microscopy of liver sinusoidal endothelial cell fenestrations
Abstract
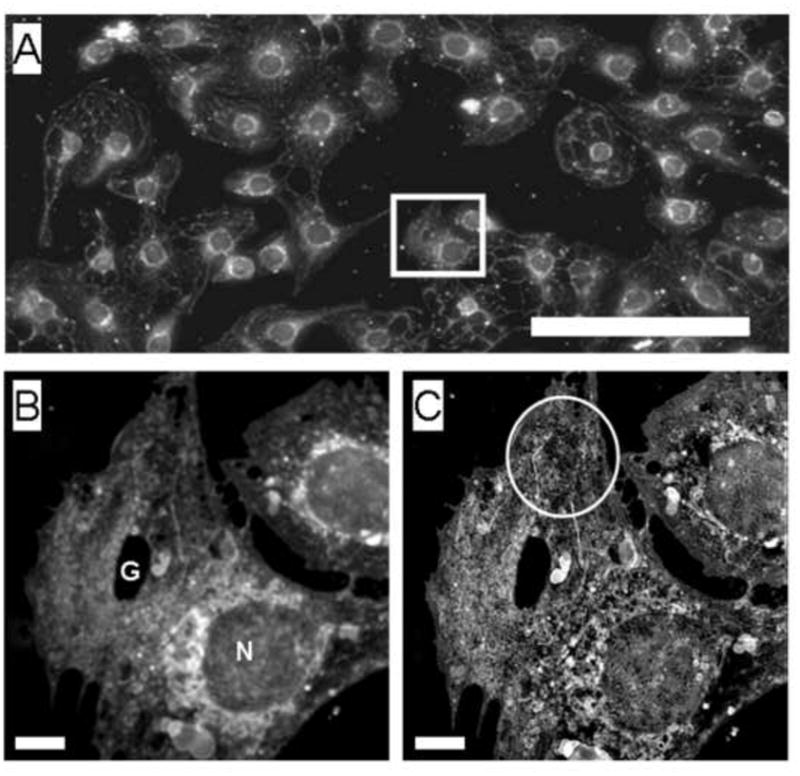
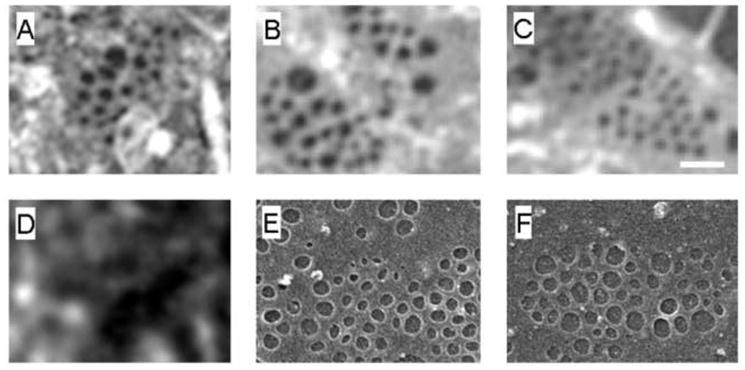
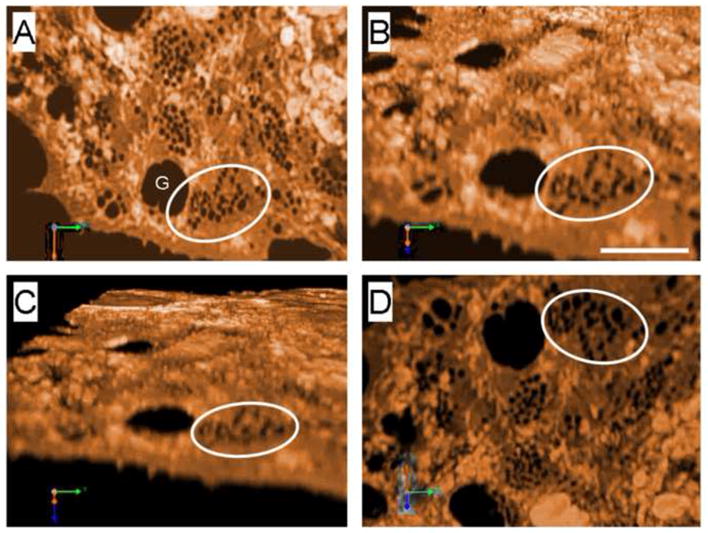
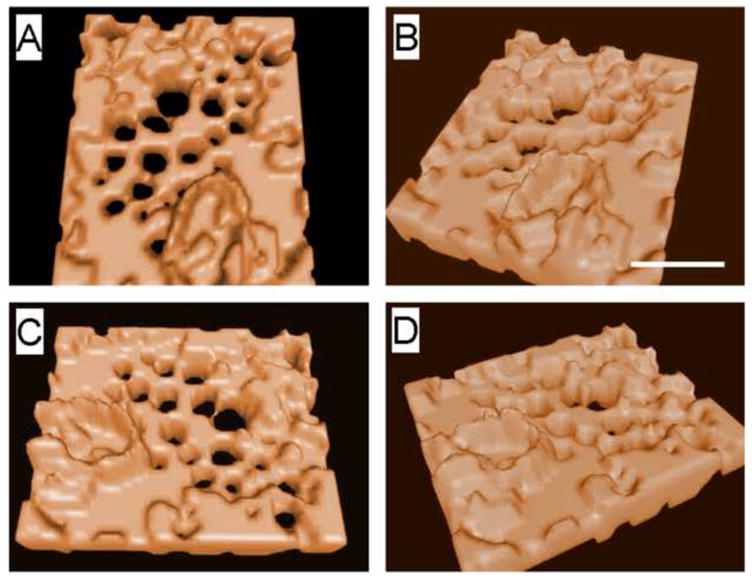
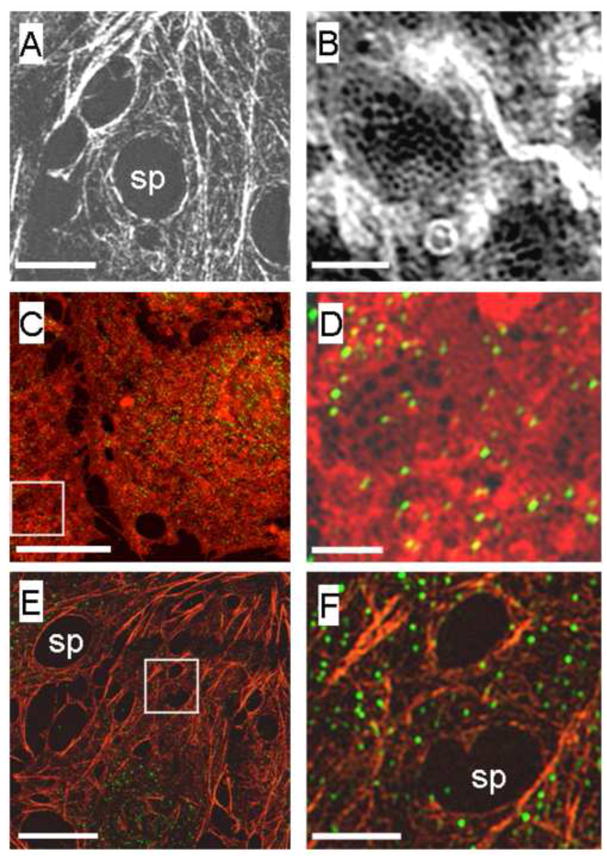
Fenestrations are pores in liver sinusoidal endothelial cells that filter substrates and debris between the blood and hepatocytes. Fenestrations have significant roles in aging and the regulation of lipoproteins. However their small size (<200 nm) has prohibited any functional analysis by light microscopy. We employed structured illumination light microscopy to observe fenestrations in isolated rat liver sinusoidal endothelial cells with great clarity and spatial resolution. With this method, the three-dimensional structure of fenestrations (diameter 123+/-24 nm) and sieve plates was elucidated and it was shown that fenestrations occur in areas of abrupt cytoplasmic thinning (165+/-54 nm vs. 292+/-103 nm in non-fenestrated regions, P<0.0001). Sieve plates were not preferentially co-localized with fluorescently labeled F-actin stress fibers and endothelial nitric oxide synthase but appeared to occur in primarily attenuated non-raft regions of the cell membrane. Labyrinthine structures were not seen and all fenestrations were short cylindrical pores. In conclusion, three-dimensional structured illumination microscopy has enabled the unlimited power of fluorescent immunostaining and co-localization to reveal new structural and functional information about fenestrations and sieve plates.
Copyright 2010 Elsevier Inc. All rights reserved.
Figures
Similar articles
-
The Relationship between fenestrations, sieve plates and rafts in liver sinusoidal endothelial cells.PLoS One. 2012;7(9):e46134. doi: 10.1371/journal.pone.0046134. Epub 2012 Sep 24. PLoS One. 2012. PMID: 23029409 Free PMC article.
-
Tuning of Liver Sieve: The Interplay between Actin and Myosin Regulatory Light Chain Regulates Fenestration Size and Number in Murine Liver Sinusoidal Endothelial Cells.Int J Mol Sci. 2022 Aug 30;23(17):9850. doi: 10.3390/ijms23179850. Int J Mol Sci. 2022. PMID: 36077249 Free PMC article.
-
Manipulating fenestrations in young and old liver sinusoidal endothelial cells.Am J Physiol Gastrointest Liver Physiol. 2019 Jan 1;316(1):G144-G154. doi: 10.1152/ajpgi.00179.2018. Epub 2018 Oct 4. Am J Physiol Gastrointest Liver Physiol. 2019. PMID: 30285464 Free PMC article.
-
Cooperation of liver cells in health and disease.Adv Anat Embryol Cell Biol. 2001;161:III-XIII, 1-151. doi: 10.1007/978-3-642-56553-3. Adv Anat Embryol Cell Biol. 2001. PMID: 11729749 Review.
-
The liver sieve and atherosclerosis.Pathology. 2012 Apr;44(3):181-6. doi: 10.1097/PAT.0b013e328351bcc8. Pathology. 2012. PMID: 22406487 Review.
Cited by
-
Organotypic liver culture models: meeting current challenges in toxicity testing.Crit Rev Toxicol. 2012 Jul;42(6):501-48. doi: 10.3109/10408444.2012.682115. Epub 2012 May 15. Crit Rev Toxicol. 2012. PMID: 22582993 Free PMC article. Review.
-
Quantitative analysis of autophagy using advanced 3D fluorescence microscopy.J Vis Exp. 2013 May 3;(75):e50047. doi: 10.3791/50047. J Vis Exp. 2013. PMID: 23665532 Free PMC article.
-
Liver endothelial cells in NAFLD and transition to NASH and HCC.Cell Mol Life Sci. 2023 Oct 5;80(11):314. doi: 10.1007/s00018-023-04966-7. Cell Mol Life Sci. 2023. PMID: 37798474 Free PMC article. Review.
-
Mimicking the Liver Sinusoidal Endothelial Cell Niche In Vitro to Enhance Fenestration in a Genetic Model of Systemic Inflammation.Cells. 2025 Apr 21;14(8):621. doi: 10.3390/cells14080621. Cells. 2025. PMID: 40277946 Free PMC article.
-
[An update of understanding of the hepatic vascular system and new research strategies].Nan Fang Yi Ke Da Xue Xue Bao. 2022 Dec 20;42(12):1907-1911. doi: 10.12122/j.issn.1673-4254.2022.12.22. Nan Fang Yi Ke Da Xue Xue Bao. 2022. PMID: 36651262 Free PMC article. Review. Chinese.
References
-
- Baker RW. Membrane technology and applications. John Wiley & Sons; Hoboken: 2004. Membrane transport theory; pp. 15–87.
-
- Braet F, De Zanger R, Jans D, Spector I, Wisse E. Microfilament-disrupting agent latrunculin A induces and increased number of fenestrae in rat liver sinusoidal endothelial cells: comparison with cytochalasin B. Hepatology. 1996;24:627–35. - PubMed
-
- Braet F, Muller M, Vekemans K, Wisse E, Le Couteur DG. Antimycin A-induced defenestration in rat hepatic sinusoidal endothelial cells. Hepatology. 2003;38:394–402. - PubMed
-
- Braet F, Wisse E, Bomans P, Frederik P, Geerts W, Koster A, Soon L, Ringer S. Contribution of high-resolution correlative imaging techniques in the study of the liver sieve in three-dimensions. Microsc Res Tech. 2007;70:230–42. - PubMed
-
- Carlton PM. Three-dimensional structured illumination microscopy and its application to chromosome structure. Chromosome Res. 2008;16:351–65. - PubMed
Publication types
MeSH terms
Substances
Grants and funding
LinkOut - more resources
Full Text Sources
Other Literature Sources
