. 2010 Sep;299(3):E486-96.
doi: 10.1152/ajpendo.00330.2010. Epub 2010 Jun 22.

Single-cell analysis of insulin-regulated fatty acid uptake in adipocytes

Affiliations

Single-cell analysis of insulin-regulated fatty acid uptake in adipocytes

Oleg Varlamov et al. Am J Physiol Endocrinol Metab. 2010 Sep.

Abstract

Increased body fat correlates with the enlargement of average fat cell size and reduced adipose tissue insulin sensitivity. It is currently unclear whether adipocytes, as they accumulate more triglycerides and grow in size, gradually become less insulin sensitive or whether obesity-related factors independently cause both the enlargement of adipocyte size and reduced adipose tissue insulin sensitivity. In the first instance, large and small adipocytes in the same tissue would exhibit differences in insulin sensitivity, whereas, in the second instance, adipocyte size per se would not necessarily correlate with insulin response. To analyze the effect of adipocyte size on insulin sensitivity, we employed a new single-cell imaging assay that resolves fatty acid uptake and insulin response in single adipocytes in subcutaneous adipose tissue explants. Here, we report that subcutaneous adipocytes are heterogeneous in size and intrinsic insulin sensitivity. Whereas smaller adipocytes respond to insulin by increasing lipid uptake, adipocytes with cell diameters larger than 80-100 microm are insulin resistant. We propose that, when cell size approaches a critical boundary, adipocytes lose insulin-dependent fatty acid transport. This negative feedback mechanism may protect adipocytes from lipid overload and restrict further expansion of adipose tissue, which leads to obesity and metabolic complications.


Figures

Fig. 1.
Fig. 1.
The use of Bodipy-C12 for quantifying fatty acid (FA) uptake in adipose tissue explants. A: adipose tissue explants were immobilized at the bottom of the imaging chamber with 0.4-mm stainless steel mesh, and M199 medium was added alone or in the presence of 10 nM insulin. Following a 2-h insulin treatment, explants were labeled for 10 min with 2.5 μM green Bodipy-C12, fixed, and analyzed by confocal microscopy. For each explant, 3 independent sectors of Bodipy-labeled fat cells (quadrant 8, red squares) were analyzed. Each experimental condition (basal or insulin treatment) was duplicated, and the data collected from 6 sectors were pulled together for further analysis. B: Co-uptake of Bodipy-C12 (green) and NBD-2-deoxyglucose (red). Top images were taken using a ×10 objective; bottom images represent higher-resolution images taken with a ×20 objective. Bars = 100 μm. C: confocal images of the Bodipy-C12-labeled fat explant. Fat explants pretreated with insulin were labeled with red Bodipy-C12 for 2 h (red; middle), washed, and pulsed for 10 min with green Bodipy-C12 (green; left). Longer exposure to red Bodipy-C12 resulted in the labeling of the majority of the cells in the explant, although the efficiency of labeling varied. Right: bright-field image showing the fat explant and a part of metal mesh. Images represent the sum of z-slices. Bars = 100 μm. D: Bodipy-C12 transport into insulin-sensitive adipose tissue requires cell integrity. To identify live and dead adipocytes, insulin-pretreated fat explants were labeled with ethidium homodimer, as described in materials and methods, and then with Bodipy-C12. The nuclei of dead cells are dye permeable and stained in red. Note that areas of adipose tissue exhibiting red staining are devoid of green fluorescence. Bars = 100 μm. E: insulin-resistant adipose tissue does not accumulate significant amounts of Bodipy-C12. Adipose tissue comprised of large adipocytes was treated with insulin, ethidium homodimer, and Bodipy-C12, as described above. Left: normal contrast; right: enhanced contrast images. Bars = 100 μm.
Fig. 2.
Fig. 2.
The effect of light scattering on Bodipy-C12 fluorescence in adipose tissue. Adipose tissue containing large fat cells (as in Fig. 1E) was labeled with Bodipy-C12. A: a closeup XYZ image of an outer layer of adipose tissue explant. The 148-μm-thick stack of images was digitally resliced in YZ and XZ directions (step size, 5 μm). B: mean intracellular fluorescence of individual adipocytes residing in the outer cell layer was measured in YZ and XZ slices and plotted against the distance from the center of the cell to the coverslip.
Fig. 3.
Fig. 3.
Diffusion of Bodipy-C12 in adipose tissue. A: a sample of adipose tissue that was insulin resistant and transported Bodipy-C12 by diffusion was incubated with Bodipy-C12 and the fluorescent quencher, as described in materials and methods. Time-lapse microscopy shows dye penetration in the explant. Shown in red, the explant was prelabeled with red Bodipy-C12. The regions of interest used to quantify mean intracellular fluorescence are shown as white (outer cell layer), yellow (intermediate cell layers), and green circles (deep cell layers). Bar = 100 μm. B: correlation between cell size and mean intracellular fluorescence. Adipocytes were binned according to sizes, and their average intracellular fluorescence was plotted against the average cell area. Three independent explants were analyzed; each size group contained 8–15 cells. C: an example of fluorescent traces. The outer layer of cells in the explant (white circle) is easily accessible to Bodipy-C12, whereas inner layers of cells (yellow and green circles) receive dye after a substantial delay. D: at 600 s, Bodipy-C12 preferentially accumulates in the outer layer of the explant, with little labeling detected in deeper cell layers. Black bar represents background fluorescence.
Fig. 4.
Fig. 4.
Real-time imaging of FA uptake in living adipose tissue. A: explants from insulin-sensitive adipose tissue were pretreated with 10 nM insulin and labeled with red Bodipy-C12 and placed on a confocal stage equilibrated to 37°C, and a focal plane was captured using the red fluorescent image (top left). The QBT reagent was added at time “0”, and single-plane images were recorded every 10 s. Because of the presence of a membrane-impermeable Bodipy quencher in the medium, background fluorescence remains low. Bar = 100 μm. B: time course of Bodipy-C12 uptake. Compartmental fluorescence was calculated as mean fluorescence of the regions of interest containing portions of cell cytoplasm (inset) and lipid droplets. Error bars represent SE; n = 20. C and D: high-resolution 3D images of retroperitoneal adipocytes labeled with Bodipy-C12 for 10 min. In D, cells were costained with Bodipy-C12 (green) and wheat germ agglutinin (red) that outlines the plasma membrane. Bar = 10 μm. E: example of very small adipocytes containing multiple lipid droplets. Bar = 10 μm.
Fig. 5.
Fig. 5.
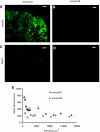
Active FA transport in adipose tissue. Insulin-stimulated retroperitoneal fat explants were incubated in medium alone (A and B) or in the presence of 100 μM lipid mixture (C and D) prior to Bodipy-C12 addition. Nuclei of dead cells were visualized with ethidium homodimer, as described in materials and methods. Arrowheads point at active live adipocytes. *Dead cells. D: a high-contrast image of the photograph in C. Bar = 10 μm. E: mean intracellular fluorescence calculated for control live (n = 66) and dead (n = 40) adipocytes and lipid-treated live (n = 14) and dead (n = 20) adipocytes. The t-test shows statistical differences between groups.
Fig. 6.
Fig. 6.
Intratissue heterogeneity in insulin sensitivity in small and larger adipocytes. Middle abdominal body fat was isolated from the animal with small adipocytes (A and C) or the animal with large adipocytes (B and D). Explants were incubated with 10 nM insulin (A and B) or in the medium alone (C and D) and labeled with Bodipy-C12, as described in Fig. 1A. Cell areas and mean intracellular fluorescence were determined as described in materials and methods and Supplemental Figs. S1 and S4. Bars = 100 μm. E: adipocytes were divided into cell size groups (n = 5–20 cells/group), and the average cell areas of each group were plotted against the average intracellular fluorescence of each group. ○ and gray circles, Insulin-sensitive adipose tissue; ◊ and gray diamonds, insulin-resistant adipose tissue. Open symbols, basal FA uptake; filled symbols, insulin-stimulated FA uptake.
Fig. 7.
Fig. 7.
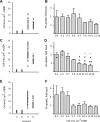
Individual heterogeneity in insulin response is related to adipocyte size. A, C, and E: cell size distribution in adipose tissue of individual animals. B, D, and F: insulin sensitivity of adipocytes of different sizes. Explants derived from upper body fat (A and B), middle abdominal body fat (C and D), and lower body fat (E and F) were incubated with or without 10 nM insulin and labeled with Bodipy-C12, as described in Fig. 1. Cell areas, mean fluorescent intensities, and insulin sensitivity were determined and analyzed as described in materials and methods. For each cell size group, mean intracellular fluorescence under insulin-stimulated conditions was normalized to mean intracellular fluorescence under basal conditions. D: 1-way ANOVA showed the main effect of cell sizes on insulin sensitivity of abdominal adipocytes; F(6,13) = 15.86, P < 0.0009. Tukey's multiple comparison test shows statistically significant differences between the following cell size groups: *“0–1” and “9–15”; #“1–2” and “9–15”; +“5–7” and “9–15”. * and +P < 0.05; ** and #P < 0.01.

Similar articles

Cited by

References

    1. Abel ED, Peroni O, Kim JK, Kim YB, Boss O, Hadro E, Minnemann T, Shulman GI, Kahn BB. Adipose-selective targeting of the GLUT4 gene impairs insulin action in muscle and liver. Nature 409: 729–733, 2001 - PubMed
    1. Agarwal AK, Garg A. Genetic disorders of adipose tissue development, differentiation, and death. Annu Rev Genomics Hum Genet 7: 175–199, 2006 - PubMed
    1. Ahima RS. Adipose tissue as an endocrine organ. Obesity (Silver Spring) 14, Suppl 5: 242S–249S, 2006 - PubMed
    1. Bergman RN, Ader M. Free fatty acids and pathogenesis of type 2 diabetes mellitus. Trends Endocrinol Metab 11: 351–356, 2000 - PubMed
    1. Berk PD, Zhou SL, Kiang CL, Stump D, Bradbury M, Isola LM. Uptake of long chain free fatty acids is selectively up-regulated in adipocytes of Zucker rats with genetic obesity and non-insulin-dependent diabetes mellitus. J Biol Chem 272: 8830–8835, 1997 - PubMed

Publication types

LinkOut - more resources