. 2010 Jul 1;70(13):5348-57.
doi: 10.1158/0008-5472.CAN-09-4593. Epub 2010 Jun 22.

Altered dynamics of intestinal cell maturation in Apc1638N/+ mice

Affiliations

Altered dynamics of intestinal cell maturation in Apc1638N/+ mice

Donghai Wang et al. Cancer Res. .

Abstract

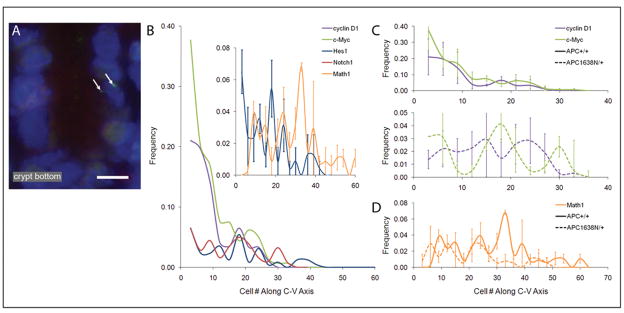
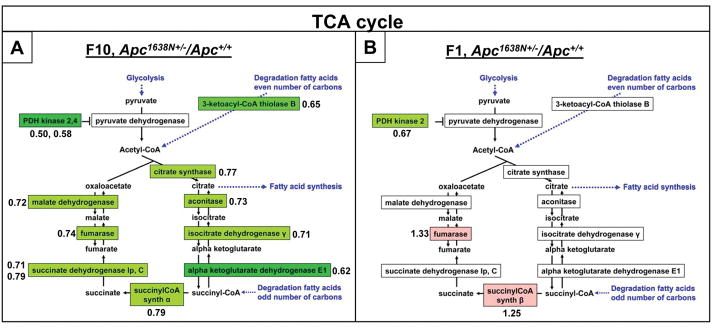
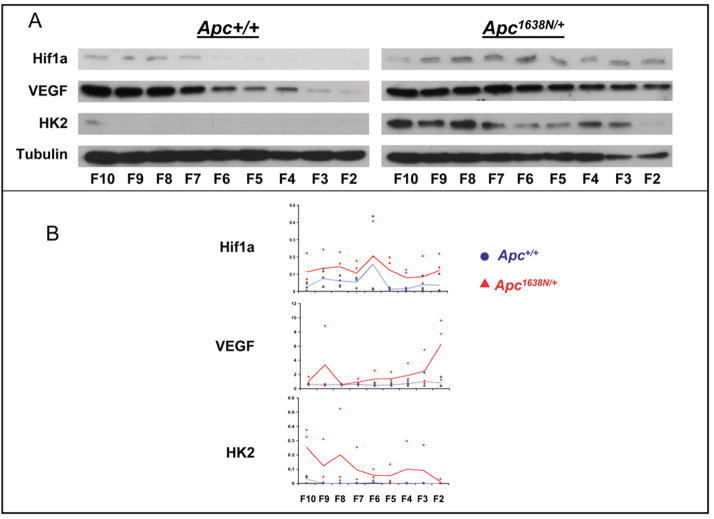
Novel imaging of active transcription sites in interphase nuclei of intestinal epithelial cells in situ showed that key genes associated with Wnt and Notch signaling were dynamically regulated as the cells underwent normal maturation during their migration along the mouse crypt-villus axis (CVA). However, oscillating patterns of activation of these genes were displaced along this axis in the histologically normal intestinal mucosa of Apc(1638N/+) mice before tumor development. Gene expression profiling then showed that the normal reprogramming of cells along the CVA was dampened in the Apc(1638N/+) mice, with an overrepresentation of c-myc target genes among those loci affected in the mutant mice. Moreover, in the Apc(1638N/+) mice, there was a perturbed pattern of expression of lineage-specific markers along the CVA consistent with transcription site repression of the Math1 gene, and genes encoding enzymes of every step of the tricarboxylic acid cycle were downregulated in the crypt of Apc(1638N/+) mice compared with WT, but not in the villus. These changes may alter energy metabolism and generate a pseudohypoxic state, suggested by elevated expression of Hif1alpha and its target genes. Thus, although intestinal tumors develop in Apc(1638N/+) mice on focal loss or inactivation of the WT allele, our results show that in the Apc(1638N/+) mouse, inheritance of only a single WT Apc allele perturbs the dynamic and complex reprogramming underlying normal cell maturation, which links epithelial function and homeostasis with architectural organization of the intestine.


Figures

Fig 1
Fig 1
1A: 2 active transcript sites (alleles) encoding Hes1 in an intestinal interphase nucleus.. The number of active transcription sites for each gene was scored in relation to cell position from the bottom of well-oriented crypts. Active transcription sites were scored in each of 50 well-oriented crypt/villi, 3 mice per genotype. Mean number of cells with active transcription sites were binned for each set of 3 consecutive positions (eg 1–3, 4–6), and plotted as a function of position along the crypt-villus axis. 1B frequency of cells with active transcription sites along the crypt-villus axis for cyclin D1, c-myc, Notch1 and Hes1 in wild-type Apc+/+ mice. Insert directly compares positions along the crypt-villus axis in Apc+/+ mice of cells with active transcription sites for Hes1 and Math1. 1C-top position of cells with active transcription sites for cyclin D1 and c-myc in the histologically normal intestinal mucosa of Apc+/+ mice; 1C-bottom, of Apc1638N/+ mutant mice; 1D directly compares distribution of cells with active transcription sites for Math1 in Apc+/+ and Apc1638N/+ mice.
Fig 2
Fig 2
A: 1720 sequences down-regulated in the F1 fraction relative to F10 for both genotypes B. 1187 sequences up-regulated in F1 fraction relative to F10 for both genotypes. Inserts in A and B are the p values for F1 relative to F10 in Apc1638N/+ mice of the same sequences on the ordinates in each panel in the same order. C: Overlap between c-myc targets and the 2217 sequences with dampened F1/F10 values (ie sequences for which values fall below the dotted red line in A and B) in the mutant mice compared to F1/F10 in wild-type. A binomial Z-test determined that the intersection of 255 genes was in excess of chance. The underlying probability of selecting a c-myc gene was p=0.0374 (=1160/31000); the null hypothesis was p=0.0374 vs. p not equal 0.0374 and the test was based on randomly selecting 2217 genes from among the 31,000. The data yielded a z = 19.3, corresponding to P<0.0001: i.e., the 255 genes among the 2217 identified are in excess of that expected by chance.
Fig. 3
Fig. 3
Ratio of lineage specific marker expression in the villi (F1 cell fraction) of 4 Apc1638N/+ mice relative to 4 Apc+/+ mice. Individual data points, and the median for each gene (horizontal line) are shown. Data are plotted on a log2 Y axis for markers of goblet cells, enteroendocrine cells and enterocytes.
Fig 4
Fig 4
Gene expression profiles were determined utilizing Affymetrix expression arrays (figure 2). Ratios of sequence mean expression compared data from F1 cell fractions (top of villus) for 4 different Apc1638N/+ mice to the same fraction for 4 different Apc+/+ mice. The same was done for F10 cell fractions (crypt bottom). Green color depicts decreased expression, red increased expression, with extent of change depicted by color intensity. For those sequences for which change is indicated, the ratio of expression in Apc1638N/+ to WT mice is shown next to the sequence. Where there are two numbers, they refer to the 2 different isoforms of the gene indicated.
Fig 5
Fig 5
Panel A immunoblot results from 1 of the 3 experiments; panel B quantitative analysis of the data from the 3 different experiments. Mixed models repeated measures analysis (MMRMA) was used as an exploratory tool to discover patterns of expression across crypt levels and between genotypes. The models were constructed first with crypt level as a dummy variable and, in cases where there appeared to be a linear or curvilinear trend, as a linear or a quadratic model, respectively. The interaction terms for genotype x crypt level were included in an appropriate way in each of the models, using p<0.05 as a guide to whether a particular model was significant. For Hif1α protein, the data suggest pattern of expression across crypts-villi is the same for both genotypes but that expression levels for Hif1α are uniformly higher for Apc1638N/+ mice (although the MMRMA could not verify this observation). For VEGF protein, the quadratic model revealed significant genotype x CVA interaction (quadratic p<0.015, linear p<0.006), suggesting curvilinear increasing trend in expression from F10 to F2 for Apc1638N/+ mice, while the expression level is relatively constant across crypt-villi for Apc+/+ mice. For Hk2 protein, the linear model revealed a significant genotype x CVA interaction (p<0.029), suggesting a linear decreasing trend in expression from F10 to F2 for Apc1638N/+ mice, while expression level is relatively constant across crypts-villi for genotype Apc+/+.

References

    1. Mariadason JM, Nicholas C, L’Italien KE, Zhuang M, Smartt HJ, Heerdt BG, et al. Gene expression profiling of intestinal epithelial cell maturation along the crypt-villus axis. Gastroenterology. 2005;128:1081–8. - PubMed
    1. Smartt H, Guilmeau S, Nasser S, Nicholas C, Bancroft L, Simpson S, et al. p27kip1 regulates cdk2 activity in the proliferating zone of the mouse intestinal epithelium: potential role in neoplasia. Gastroenterology. 2007;207:232–43. - PubMed
    1. Su L-K, Kinzler KW, Vogelstein B, Preisinger AC, Moser AR, Luongo C, et al. Multiple intestinal neoplasia caused by a mutation in the murine homolog of the APC gene. Science. 1992;256:668–70. - PubMed
    1. Fodde R, Edelmann W, Yang K, van Leeuwen C, Carlson C, Renault B, et al. A targeted chain-termination mutation in the mouse Apc gene results in multiple intestinal tumors. Proc Nat Acad Sci USA. 1994;91:8969–73. - PMC - PubMed
    1. Levy DB, Smith KJ, Beazer-Barclay Y, Hamilton SR, Vogelstein B, Kinzler KW. Inactivation of Both APC alleles in human and mouse tumors. Cancer Res. 1994;54:5953–8. - PubMed

Publication types